. 2015 Jan;138(Pt 1):164-78.
doi: 10.1093/brain/awu328. Epub 2014 Nov 28.

Motion area V5/MT+ response to global motion in the absence of V1 resembles early visual cortex

Affiliations

Motion area V5/MT+ response to global motion in the absence of V1 resembles early visual cortex

Sara Ajina et al. Brain. 2015 Jan.

Abstract

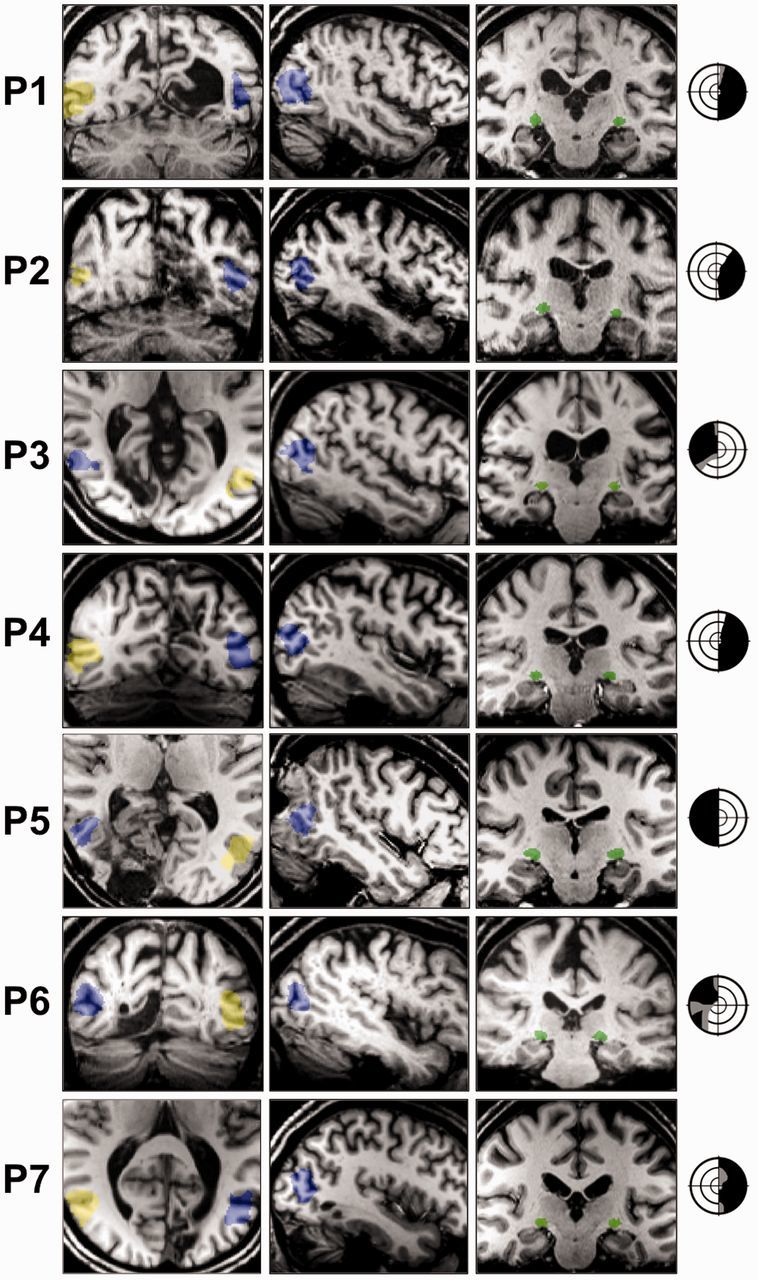
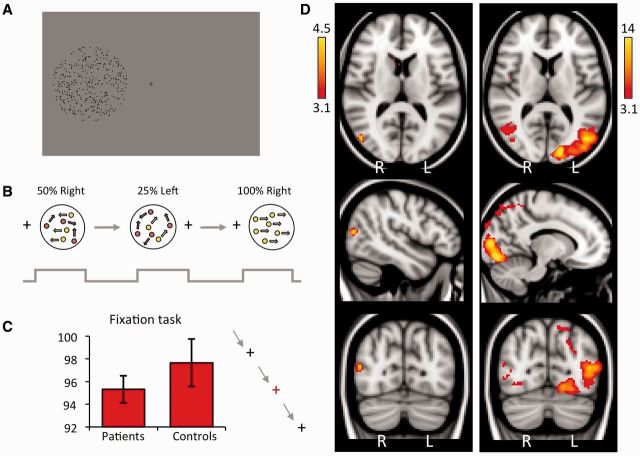
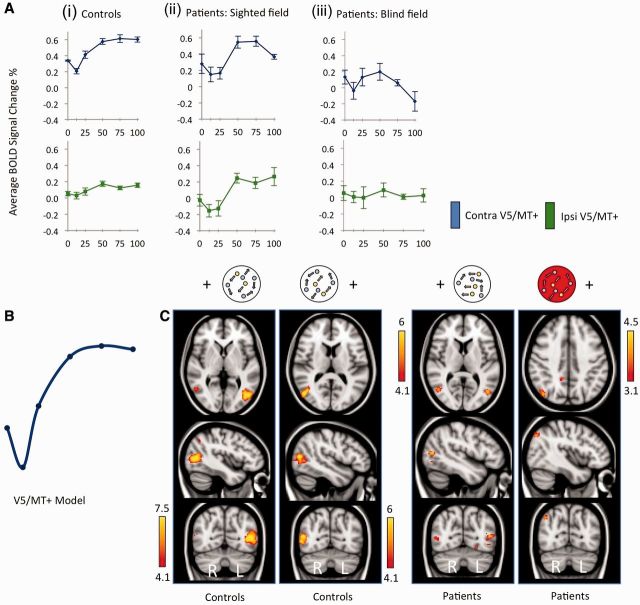
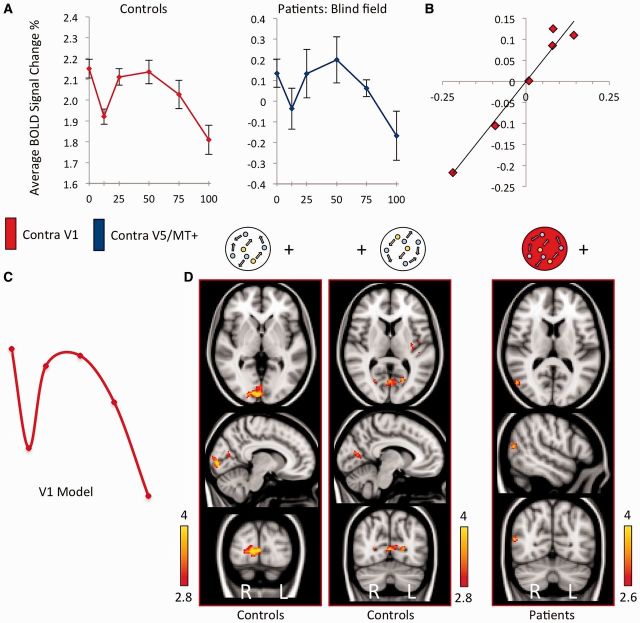
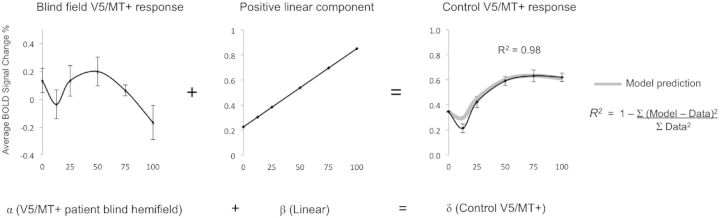
Motion area V5/MT+ shows a variety of characteristic visual responses, often linked to perception, which are heavily influenced by its rich connectivity with the primary visual cortex (V1). This human motion area also receives a number of inputs from other visual regions, including direct subcortical connections and callosal connections with the contralateral hemisphere. Little is currently known about such alternative inputs to V5/MT+ and how they may drive and influence its activity. Using functional magnetic resonance imaging, the response of human V5/MT+ to increasing the proportion of coherent motion was measured in seven patients with unilateral V1 damage acquired during adulthood, and a group of healthy age-matched controls. When V1 was damaged, the typical V5/MT+ response to increasing coherence was lost. Rather, V5/MT+ in patients showed a negative trend with coherence that was similar to coherence-related activity in V1 of healthy control subjects. This shift to a response-pattern more typical of early visual cortex suggests that in the absence of V1, V5/MT+ activity may be shaped by similar direct subcortical input. This is likely to reflect intact residual pathways rather than a change in connectivity, and has important implications for blindsight function. It also confirms predictions that V1 is critically involved in normal V5/MT+ global motion processing, consistent with a convergent model of V1 input to V5/MT+. Historically, most attempts to model cortical visual responses do not consider the contribution of direct subcortical inputs that may bypass striate cortex, such as input to V5/MT+. We have shown that the signal change driven by these non-striate pathways can be measured, and suggest that models of the intact visual system may benefit from considering their contribution.

Keywords: functional MRI; hemianopia; motion coherence; subcortical; visual cortex.


Figures

Figure 1
Figure 1
Patient neuroimaging and visual field deficits. V5/MT+ masks are overlaid on example coronal or axial (left column) and sagittal (middle column) T1-weighted slices for all seven patients (P1–P7) (radiological convention). Ipsilesional V5/MT+ is shown in blue, contralesional in yellow. Coronal slices (right column) also demonstrate the intact lateral geniculate nucleus in green. The lateral geniculate nucleus was identifiable by manual inspection of the anatomical T1-weighted images (Horton et al., 1990), with a radiological brain atlas to aid identification. Visual field deficits are adapted from 30:2 threshold Humphrey visual field perimetry reports, and show dense visual field loss in black (<0.5%) and partial loss in grey (<2%). Stimulus location was always restricted to a region of dense visual field loss. Concentric rings represent increments in retinal position of 10°, spanning the central 30°.
Figure 2
Figure 2
Experimental design, and average cortical response to visual motion in patients. (A) Experimental stimulus. Participants viewed an aperture containing moving black dots at 8 dots/°2 on a grey background, at least 2.5° from fixation. (B) The stimulus was presented to each hemifield separately at six coherence levels, with a random sequence 12-block design: 0%, 12.5%, 25%, 50%, 75%, 100%. (C) During stimulus presentation, participants were asked to perform a simple task to detect colour changes at fixation. Median performance is shown here for patient and control groups, error bars represent standard error of the mean. (D) Thresholded activation maps across all coherence levels, comparing the blind and sighted hemifields of patients. Left column: Blind ‘left’ hemifield stimulation. Peak z-statistic = 4.46, MNI coordinates: (48, −74, 14). Right column: Patients sighted ‘right’ hemifield. Peak z-statistic = 18.4, MNI coordinates: (−14, −90, 6). Fixed effects analysis, P < 0.001 uncorrected in V1 and extrastriate cortex (cluster extent threshold >10 voxels), elsewhere cluster correction threshold P < 0.01, results displayed on MNI standard brain.
Figure 3
Figure 3
V5/MT+ response to motion coherence in patients and controls. (A) Graphs show average % BOLD signal change in anatomically-defined V5/MT+ regions of interest as a function of coherence for controls (i), patients’ sighted hemifield (ii), and patients’ blind hemifield (iii). Blue lines represent contralateral V5/MT+ signal change, green represent ipsilateral. Error bars display normalized standard error of mean. (B) Schematic depiction of the demeaned data-driven V5/MT+ model for functional MRI response to motion coherence. (C) Thresholded activation maps in controls and patients, highlighting regions with a significant relationship with coherence according to the V5 model in B. Results for each hemifield are shown separately. The red aperture signifies results for the blind hemifield. Fixed-effects analysis, corrected cluster threshold P < 0.05, pre-threshold masking applied to V1 and extrastriate cortex.
Figure 4
Figure 4
V1 response to motion coherence in controls, and the cortical regions active according to this V1 model in patients and controls. (A) Average % BOLD signal change as a function of stimulus coherence. The left graph (red) shows the response pattern in contralateral V1 of control subjects, averaged across hemispheres. The right graph (blue) shows the activation in V5/MT+ of the blind hemisphere in patients. Error bars represent normalized standard error of the mean. (B) Correlation of normalized signal change in contralateral V5/MT+ for patients blind hemifield, versus contralateral V1 activation in healthy controls, r = 0.98, P < 0.01. (C) Schematic of demeaned data-driven V1 model from control subjects for functional MRI response to motion coherence. (D) Active brain regions showing a significant relationship with motion coherence according to the V1 model in C. Results for each hemifield are shown separately for controls, and patients blind hemifield (highlighted by the red aperture). Fixed-effects analysis, corrected cluster threshold P < 0.05, pre-threshold masking applied to V1 and extrastriate cortex.
Figure 5
Figure 5
Activity in V5/MT+ can be accurately predicted from a weighted-linear model. V5/MT+ activity in patients during blind hemifield stimulation can be combined with a simple positive linear component to predict BOLD signal change in V5/MT+ of controls to a high degree of precision. Relative weightings are signified here by α, β, and δ symbols.

References

    1. Albright TD, Desimone R. Local precision of visuotopic organization in the middle temporal area (MT) of the macaque. Exp Brain Res. 1987;65:582–92. - PubMed
    1. Amano K, Wandell BA, Dumoulin SO. Visual field maps population receptive field sizes and visual field coverage in the human MT+ complex. J Neurophysiol. 2009;102:2704–18. - PMC - PubMed
    1. Andersson JLR, Jenkinson M, Smith SM. Non-linear optimisation. FMRIB technical report. 2007 TR07JA1.
    1. Aspell JE, Tanskanen T, Hurlbert AC. Neuromagnetic correlates of visual motion coherence. Eur J Neurosci. 2005;22:2937–45. - PubMed
    1. Becker HG, Erb M, Haarmeier T. Differential dependency on motion coherence in subregions of the human MT+ complex. Eur J Neurosci. 2008;28:1674–85. - PubMed

Publication types

MeSH terms