. 2014 Dec 1:5:5676.
doi: 10.1038/ncomms6676.

A chemo-centric view of human health and disease

Affiliations

A chemo-centric view of human health and disease

Miquel Duran-Frigola et al. Nat Commun. .

Abstract

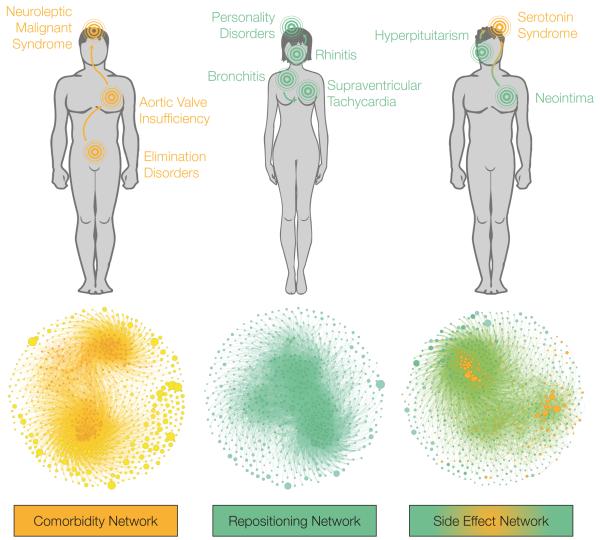
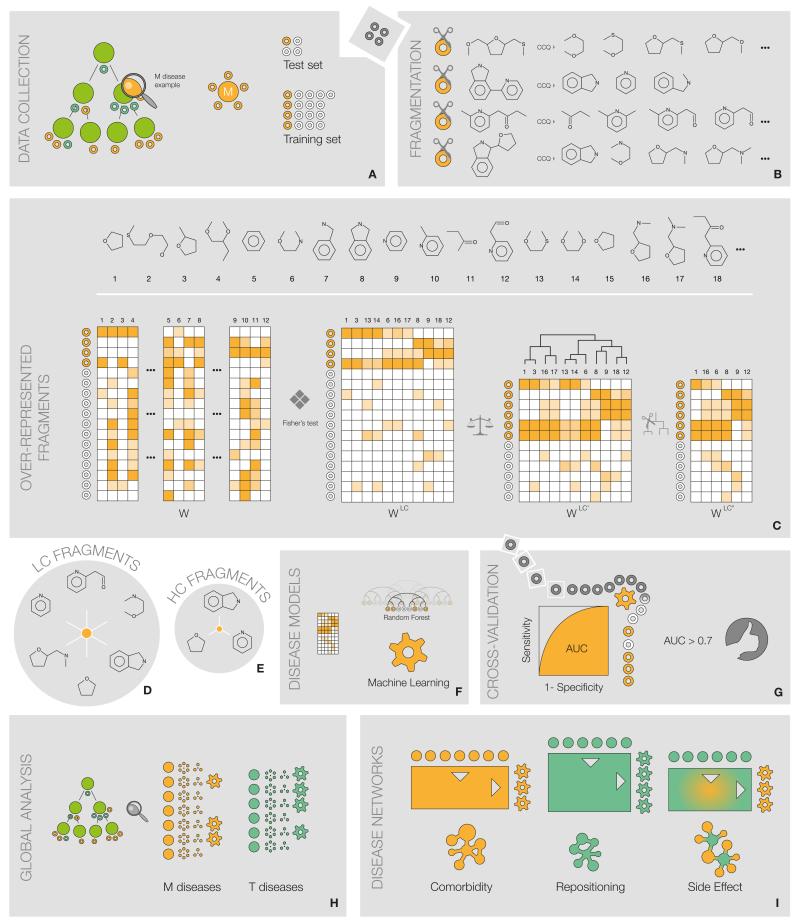
Efforts to compile the phenotypic effects of drugs and environmental chemicals offer the opportunity to adopt a chemo-centric view of human health that does not require detailed mechanistic information. Here we consider thousands of chemicals and analyse the relationship of their structures with adverse and therapeutic responses. Our study includes molecules related to the aetiology of 934 health-threatening conditions and used to treat 835 diseases. We first identify chemical moieties that could be independently associated with each phenotypic effect. Using these fragments, we build accurate predictors for approximately 400 clinical phenotypes, finding many privileged and liable structures. Finally, we connect two diseases if they relate to similar chemical structures. The resulting networks of human conditions are able to predict disease comorbidities, as well as identifying potential drug side effects and opportunities for drug repositioning, and show a remarkable coincidence with clinical observations.


Figures

Figure 1
Figure 1. Over-represented fragments
Fragments per disease (A) and diseases per fragment (C), considering only the HC set. In (B), a Voronoi diagram where each fragment is a shape with area and color proportional to the number of molecules that contain it (best match similarity > 0.8). To illustrate chemical diversity, we display the cumulative distribution of the total number of atoms (D), the number of heteroatoms (E), and the number of rings (F). Distributions are decorated with illustrative fragment structures. M and T fragment-disease relationships are shown in orange and green colors, respectively.
Figure 2
Figure 2. Privileged and liable structures
(A) Balance between privileged and liable structures, both for the HC and LC sets. % of M indicates the proportion of M associations for each fragment over its disease associations. (B) Three scaffolds that, while being mostly liable, are included in drug molecules. (C) Fragments that are privileged and remain unsuccessful or unexplored as therapeutics. Next to each structure, top and bottom pie charts represent the number of diseases for which the fragment is LC- and HC-associated, respectively. Area of pie charts is proportional to the number of diseases. To select these examples, experimental and approved drug structures were extracted from Drugbank (July 2013).
Figure 3
Figure 3. Predictive models
AUC distribution of M and T models (E). Area of violin plots is proportional to the number of diseases. Example ROC plots for M and T chemical-disease relationships are shown in (A—D) and (F—I), respectively.
Figure 4
Figure 4. Disease categories of successful models
M and T plausible disease models classified in high-level disease categories. Each circle represents an M or T disease model belonging to the corresponding category. Area of circles is proportional to the number of associated molecules in our dataset.
Figure 5
Figure 5. Disease networks
Disease comorbidity, drug repositioning and drug side effect networks. Examples discussed in the text are depicted with directed links on top of each network. To select these examples, we looked for strong correlations (see Materials and Methods) occurring between diseases in different categories. None of the cases share annotated chemicals, highlighting the value of our fragment-based models. Networks are displayed with a gravity layout, being node size proportional to the number of related chemicals. Network statistics can be found in Table 2.
Figure 6
Figure 6. Scheme of the method
Analysis protocol exemplified for an M disease of interest. (A) Annotated molecules are collected and split in training and test sets. (B) M training molecules are fragmented using CCQ rules. (C) W is built from the resulting fragments (columns) and the training set (rows) (stratified 10-fold cross-validation). W undergoes a significance filtering, a data balancing step, a column clustering and a pruning, resulting in WLC’. (D) Columns of WLC’ constitute the LC set of fragments; (E) further filtering considering substructural relationships and co-occurrence in molecules yields the HC set. (F) Using WLC’, a random forest classifier is learned, and (G) tested against the test set. If the model performs with AUC > 0.7, it is considered of good quality. (H) Steps 1-7 are conducted for all M and T chemical-disease relationships. (I) Using plausible models, chemo-centric disease networks are constructed.

References

    1. Yildirim MA, Goh KI, Cusick ME, Barabasi AL, Vidal M. Drug-target network. Nature biotechnology. 2007;25:1119–1126. doi:10.1038/nbt1338. - PubMed
    1. Bauer-Mehren A, et al. Automatic filtering and substantiation of drug safety signals. PLoS computational biology. 2012;8:e1002457. doi:10.1371/journal.pcbi.1002457. - PMC - PubMed
    1. Pujol A, Mosca R, Farres J, Aloy P. Unveiling the role of network and systems biology in drug discovery. Trends in pharmacological sciences. 2010;31:115–123. doi:10.1016/j.tips.2009.11.006. - PubMed
    1. Keiser MJ, Irwin JJ, Shoichet BK. The chemical basis of pharmacology. Biochemistry. 2010;49:10267–10276. doi:10.1021/bi101540g. - PMC - PubMed
    1. Davis AP, et al. The Comparative Toxicogenomics Database: update 2013. Nucleic acids research. 2013;41:D1104–1114. doi:10.1093/nar/gks994. - PMC - PubMed

Publication types