. 2014 Dec 18;56(6):796-807.
doi: 10.1016/j.molcel.2014.10.025. Epub 2014 Nov 26.

A computational algorithm to predict shRNA potency

Affiliations

A computational algorithm to predict shRNA potency

Simon R V Knott et al. Mol Cell. .

Abstract

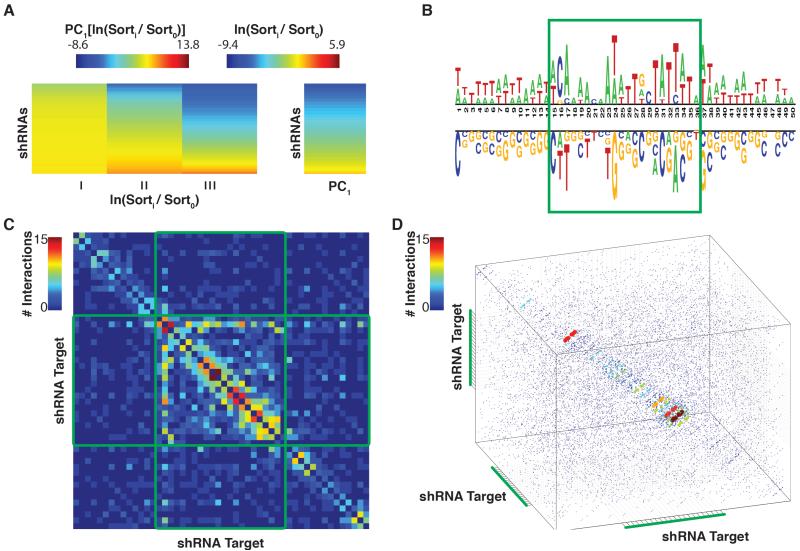
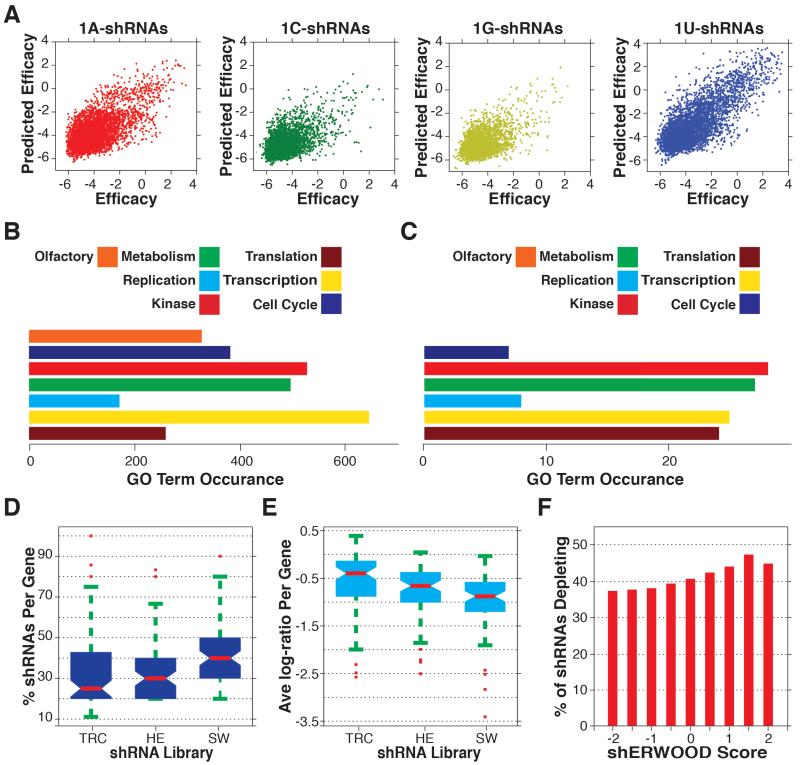
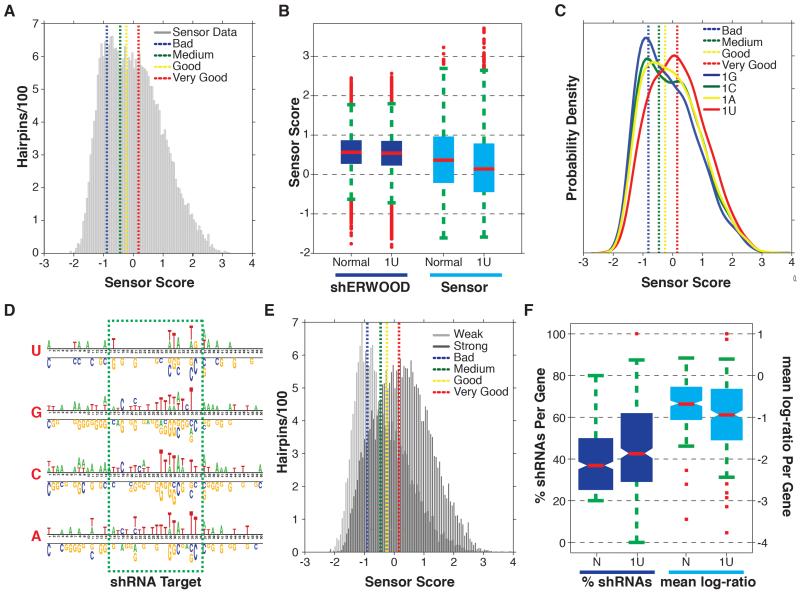
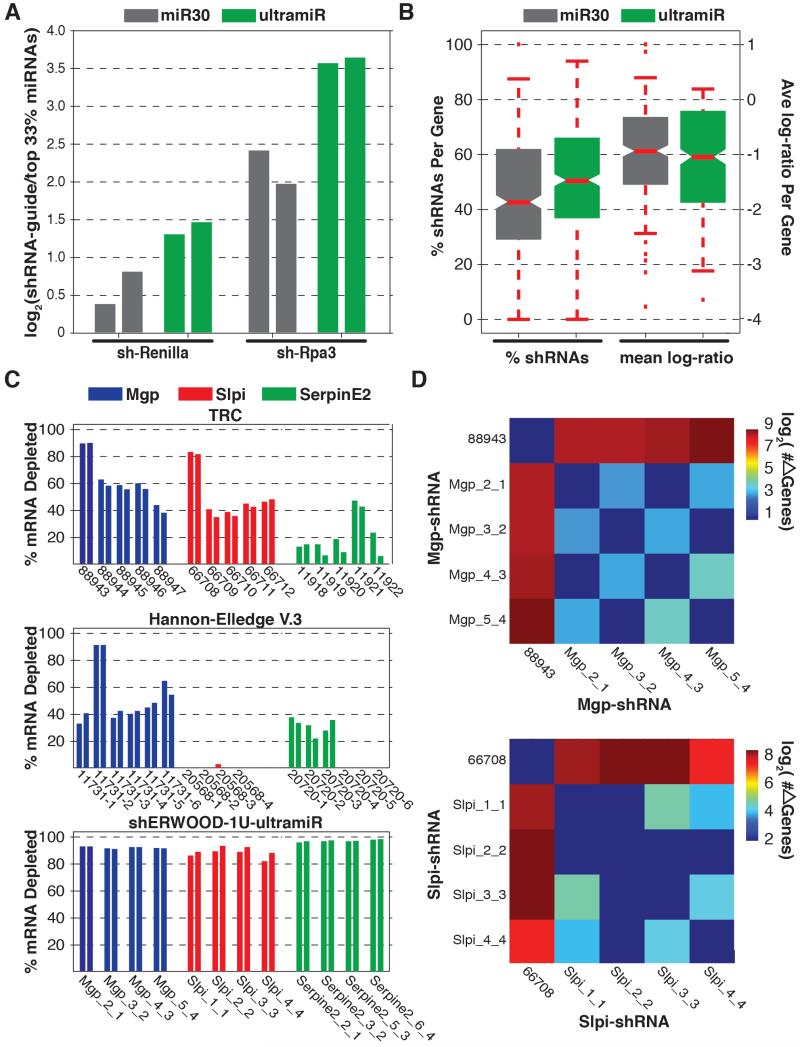
The strength of conclusions drawn from RNAi-based studies is heavily influenced by the quality of tools used to elicit knockdown. Prior studies have developed algorithms to design siRNAs. However, to date, no established method has emerged to identify effective shRNAs, which have lower intracellular abundance than transfected siRNAs and undergo additional processing steps. We recently developed a multiplexed assay for identifying potent shRNAs and used this method to generate ∼250,000 shRNA efficacy data points. Using these data, we developed shERWOOD, an algorithm capable of predicting, for any shRNA, the likelihood that it will elicit potent target knockdown. Combined with additional shRNA design strategies, shERWOOD allows the ab initio identification of potent shRNAs that specifically target the majority of each gene's multiple transcripts. We validated the performance of our shRNA designs using several orthogonal strategies and constructed genome-wide collections of shRNAs for humans and mice based on our approach.


Figures

Figure 1
Figure 1. Identification of Sequence Characteristics Predictive of shRNA Efficacy
A) shRNA score determination via sensor NGS data. On the left is a heatmap representation of normalized shRNA read counts for each on-dox sensor sort. The right panel represents shRNA potencies, calculated by extracting the first principal component of the left panel matrix. B) A nucleotide logo representing enriched (top) and depleted (bottom) nucleotides (p-value < 0.05) in potent shRNAs. C) A heatmap demonstrating the predictive capacity (with respect to shRNA potency) of each pair of positions within the target region. Heatmap cells are colored to represent the number of nucleotide combinations that were significantly predictive (p-value <0.05), at each position-pair. D) The predictive capacity of each triplet of positions within the target region. Data-point colors and sizes represent the number of nucleotide triplets that were significantly predictive (p-value <0.05) at each position-triplet.
Figure 2
Figure 2. Construction and Validation of an shRNA-specific Predictive Algorithm
A) Consolidated cross validation of predictions vs. sensor-scores for all shRNAs in the Fellmann et al. dataset (shRNAs are separated by the guide 5′ nucleotide). B) GO-term instances associated with the targeted gene set selected for shRNA validation screens. C) GO-term instances associated with genes for which at least two hairpins significantly depleted in each of the TRC, Hannon-Elledge (HE) and shERWOOD (SW) validation screens D) The percentage of shRNAs targeting consensus essential genes that depleted in each of the TRC, HE and shERWOOD shRNA screens. E) Average log-fold change for shRNAs targeting consensus essential genes (per gene) for each of the TRC, EH and shERWOOD validation screens. F) The percentage of shRNAs corresponding to consensus essential genes that, for any given shERWOOD score, depleted in the shERWOOD validation screen.
Figure 3
Figure 3. Structure-guided Maximization of shRNA-Prediction Space
A) Histogram of sensor scores for the top fifteen shRNAs, as identified by the shERWOOD-1U strategy, targeting ~2000 “druggable” genes. Overlaid are the mean sensor scores for control shRNAs representing poor, medium, potent and very potent shRNAs (with mean knockdown efficiencies of 25%, 50%, 75% and >90%, respectively). B) The distribution of shERWOOD-1U prediction scores for shRNAs where endogenous 1U-shRNAs are separated from endogenous non-1U-shRNAs. Sensor scores for endogenous 1U- and non-1U-shRNAS are displayed on the left. C) Distribution of sensor scores for shERWOOD-1U-selected shRNAs, separated by endogenous guide 5′ nucleotides. D) A nucleotide logo representing enriched (top) and depleted (bottom) nucleotides (p-value < 0.05) in potent shERWOOD-1U-selected shRNAs (separated by endogenous guide 5′ nucleotides). E) The distribution of sensor scores for shRNAs classified as weak and potent by a random forest classifier trained on the shERWOO-1U sensor data. F) The distributions of the percentage of shERWOOD- and shERWOOD-1U-selected shRNAs targeting consensus essential genes that depleted in validation screens (left). In addition normalized log-fold changes of shRNAs, identified under each selection scheme, are displayed (right).
Figure 4
Figure 4. Validation of an Alternative Mir Scaffold
A) Relative abundances of processed guide sequences for two shRNAs (as determined via small RNA cloning + NGS analysis) when cloned into traditional miR30 and ultramiR scaffolds. Values represent the log-fold enrichment of shRNA guides with respect to sequences corresponding to the ten most abundant microRNAs. B) Distributions of the percentage of shHERWOOD-1U-selected shRNAs targeting consensus essential genes that depleted in validation screens when shRNAs were placed into miR30 and ultramiR scaffolds. Log-fold changes for the same constructs are displayed on the left. C) Knockdown efficiencies for shRNAs targeting mouse genes Mgp, Slpi and Mgp. shRNAs assessed were those contained within the TRC collection, those initially designed for the Hannon-Elledge V.3 library and those designed using the current strategies. the TRC and Hannon-Elledge V.3 shRNAs are housed within each libraries lentiviral vectors, while the shERWOOD-1U selected shRNAs are housed within an ultramiR scaffold in a retroviral vector. Ultramir is constitutively expressed from the LTR. D) The number of differentially expressed genes (> 2-fold change and FDR < 0.05) identified through pairwise comparisons of the cell lines corresponding to Mgp and Slpi knockdown by the shERWOOD-1U selected shRNAs and the TRC shRNAs 88943 and 66708.

References

    1. Ameres SL, Zamore PD. Diversifying microRNA sequence and function. Nature reviews. Molecular cell biology. 2013;14:475–488. - PubMed
    1. Auyeung VC, Ulitsky I, McGeary SE, Bartel DP. Beyond secondary structure: primary-sequence determinants license pri-miRNA hairpins for processing. Cell. 2013;152:844–858. - PMC - PubMed
    1. Babij C, Zhang Y, Kurzeja RJ, Munzli A, Shehabeldin A, Fernando M, Quon K, Kassner PD, Ruefli-Brasse AA, Watson VJ, et al. STK33 kinase activity is nonessential in KRAS-dependent cancer cells. Cancer research. 2011;71:5818–5826. - PubMed
    1. Baek ST, Kerjan G, Bielas SL, Lee JE, Fenstermaker AG, Novarino G, Gleeson JG. Off-target effect of doublecortin family shRNA on neuronal migration associated with endogenous microRNA dysregulation. Neuron. 2014;82:1255–1262. - PMC - PubMed
    1. Berns K, Hijmans EM, Mullenders J, Brummelkamp TR, Velds A, Heimerikx M, Kerkhoven RM, Madiredjo M, Nijkamp W, Weigelt B, et al. A large-scale RNAi screen in human cells identifies new components of the p53 pathway. Nature. 2004;428:431–437. - PubMed

Associated data