

The influence of mammographic technologists on radiologists' ability to interpret screening mammograms in community practice
- PMID: 25435185
- PMCID: PMC4324008
- DOI: 10.1016/j.acra.2014.09.013
The influence of mammographic technologists on radiologists' ability to interpret screening mammograms in community practice
Abstract
Rationale and objectives: To determine whether the mammographic technologist has an effect on the radiologists' interpretative performance of screening mammography in community practice.
Materials and methods: In this institutional review board-approved retrospective cohort study, we included Carolina Mammography Registry data from 372 radiologists and 356 mammographic technologists from 1994 to 2009 who performed 1,003,276 screening mammograms. Measures of interpretative performance (recall rate, sensitivity, specificity, positive predictive value [PPV1], and cancer detection rate [CDR]) were ascertained prospectively with cancer outcomes collected from the state cancer registry and pathology reports. To determine if the mammographic technologist influenced the radiologists' performance, we used mixed effects logistic regression models, including a radiologist-specific random effect and taking into account the clustering of examinations across women, separately for screen-film mammography (SFM) and full-field digital mammography (FFDM).
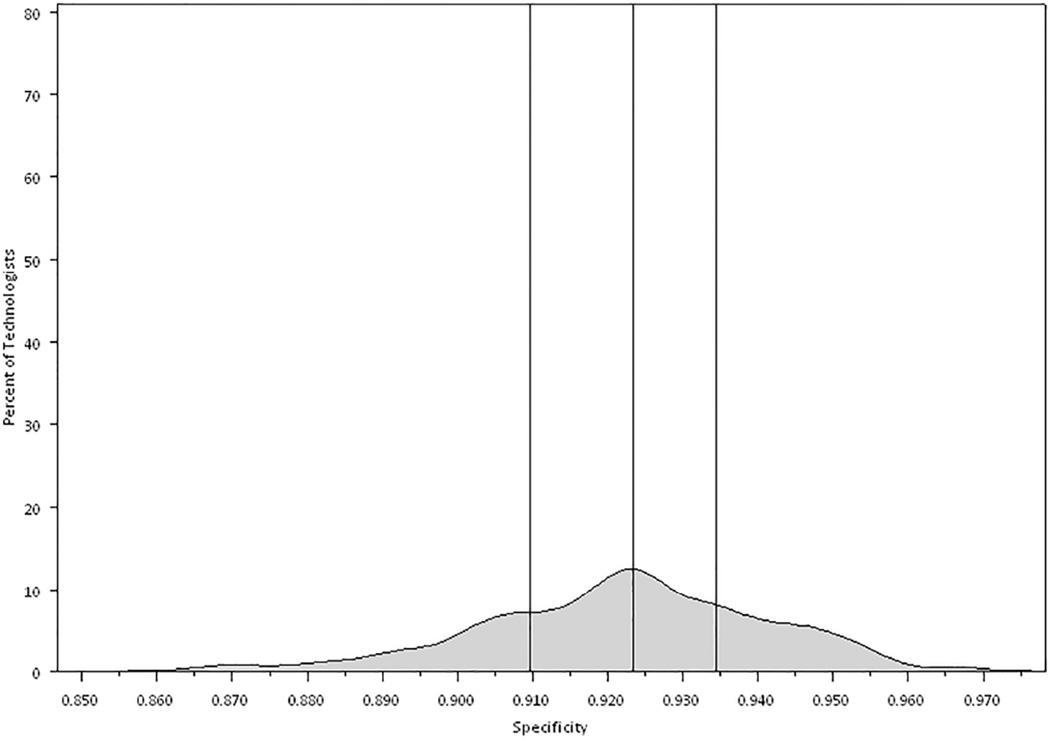
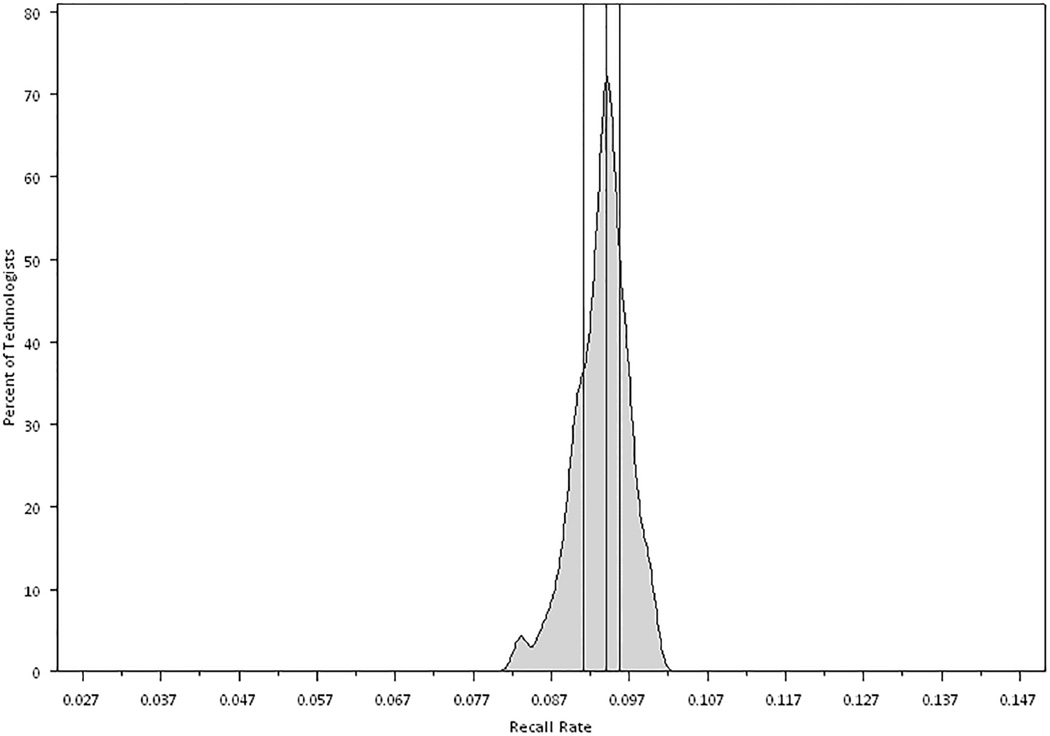
Results: Of the 356 mammographic technologists included, 343 performed 889,347 SFM examinations, 51 performed 113,929 FFDM examinations, and 38 performed both SFM and FFDM examinations. A total of 4328 cancers were reported for SFM and 564 cancers for FFDM. The technologists had a statistically significant effect on the radiologists' recall rate, sensitivity, specificity, and CDR for both SFM and FFDM (P values <.01). For PPV1, variability by technologist was observed for SFM (P value <.0001) but not for FFDM (P value = .088).
Conclusions: The interpretative performance of radiologists in screening mammography varies substantially by the technologist performing the examination. Additional studies should aim to identify technologist characteristics that may explain this variation.
Keywords: Mammography; observer variation; sensitivity and specificity.
Copyright © 2015 AUR. Published by Elsevier Inc. All rights reserved.
Figures


Similar articles
-
Do mammographic technologists affect radiologists' diagnostic mammography interpretative performance?AJR Am J Roentgenol. 2015 Apr;204(4):903-8. doi: 10.2214/AJR.14.12903. AJR Am J Roentgenol. 2015. PMID: 25794085 Free PMC article.
-
Breast cancer: missed interval and screening-detected cancer at full-field digital mammography and screen-film mammography-- results from a retrospective review.Radiology. 2012 Aug;264(2):378-86. doi: 10.1148/radiol.12112074. Epub 2012 Jun 14. Radiology. 2012. PMID: 22700555
-
Impact of the transition from screen-film to digital screening mammography on interval cancer characteristics and treatment - a population based study from the Netherlands.Eur J Cancer. 2014 Jan;50(1):31-9. doi: 10.1016/j.ejca.2013.09.018. Epub 2013 Oct 25. Eur J Cancer. 2014. PMID: 24275518
-
Impact of full field digital mammography on the classification and mammographic characteristics of interval breast cancers.Eur J Radiol. 2015 Jun;84(6):1056-61. doi: 10.1016/j.ejrad.2015.03.007. Epub 2015 Mar 14. Eur J Radiol. 2015. PMID: 25816990 Review.
-
Radiologists' interpretive efficiency and variability in true- and false-positive detection when screen-reading with tomosynthesis (3D-mammography) relative to standard mammography in population screening.Breast. 2015 Dec;24(6):687-93. doi: 10.1016/j.breast.2015.08.012. Epub 2015 Oct 1. Breast. 2015. PMID: 26433751 Review.
Cited by
-
The influence of breast density and key demographics of radiographers on mammography reporting performance - a pilot study.J Med Radiat Sci. 2022 Mar;69(1):30-36. doi: 10.1002/jmrs.486. Epub 2021 May 24. J Med Radiat Sci. 2022. PMID: 34028205 Free PMC article.
-
Impact of Full-Field Digital Mammography Versus Film-Screen Mammography in Population Screening: A Meta-Analysis.J Natl Cancer Inst. 2021 Jan 4;113(1):16-26. doi: 10.1093/jnci/djaa080. J Natl Cancer Inst. 2021. PMID: 32572492 Free PMC article.
-
Characterizing the Mammography Technologist Workforce in North Carolina.J Am Coll Radiol. 2015 Dec;12(12 Pt B):1419-26. doi: 10.1016/j.jacr.2015.06.001. J Am Coll Radiol. 2015. PMID: 26614888 Free PMC article.
References
-
- Society AC, editor. American Cancer Society. What are the key statistics about breast cancer? 2013.
-
- National Cancer Institute. Breast Cancer Screening (PDQ) Bethesda, MD: National Cancer Institute; 2010.
MeSH terms
Grants and funding
LinkOut - more resources
Full Text Sources
Other Literature Sources
Medical
