Comparative Study
. 2014 Nov 30;107(1):380.
doi: 10.1093/jnci/dju380. Print 2015 Jan.

Cost-effectiveness of population screening for BRCA mutations in Ashkenazi jewish women compared with family history-based testing

Affiliations
Comparative Study

Cost-effectiveness of population screening for BRCA mutations in Ashkenazi jewish women compared with family history-based testing

Ranjit Manchanda et al. J Natl Cancer Inst. .

Abstract

Background: Population-based testing for BRCA1/2 mutations detects the high proportion of carriers not identified by cancer family history (FH)-based testing. We compared the cost-effectiveness of population-based BRCA testing with the standard FH-based approach in Ashkenazi Jewish (AJ) women.

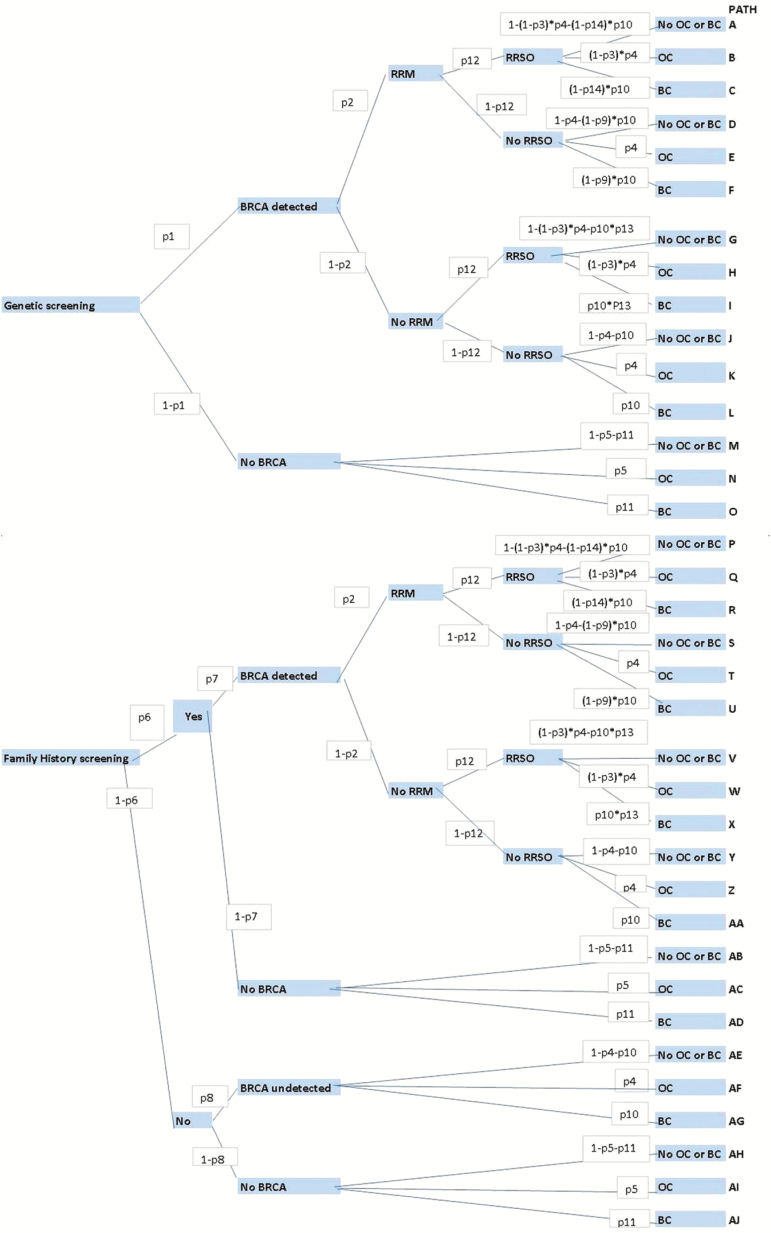
Methods: A decision-analytic model was developed to compare lifetime costs and effects amongst AJ women in the UK of BRCA founder-mutation testing amongst: 1) all women in the population age 30 years or older and 2) just those with a strong FH (≥10% mutation risk). The model assumes that BRCA carriers are offered risk-reducing salpingo-oophorectomy and annual MRI/mammography screening or risk-reducing mastectomy. Model probabilities utilize the Genetic Cancer Prediction through Population Screening trial/published literature to estimate total costs, effects in terms of quality-adjusted life-years (QALYs), cancer incidence, incremental cost-effectiveness ratio (ICER), and population impact. Costs are reported at 2010 prices. Costs/outcomes were discounted at 3.5%. We used deterministic/probabilistic sensitivity analysis (PSA) to evaluate model uncertainty.

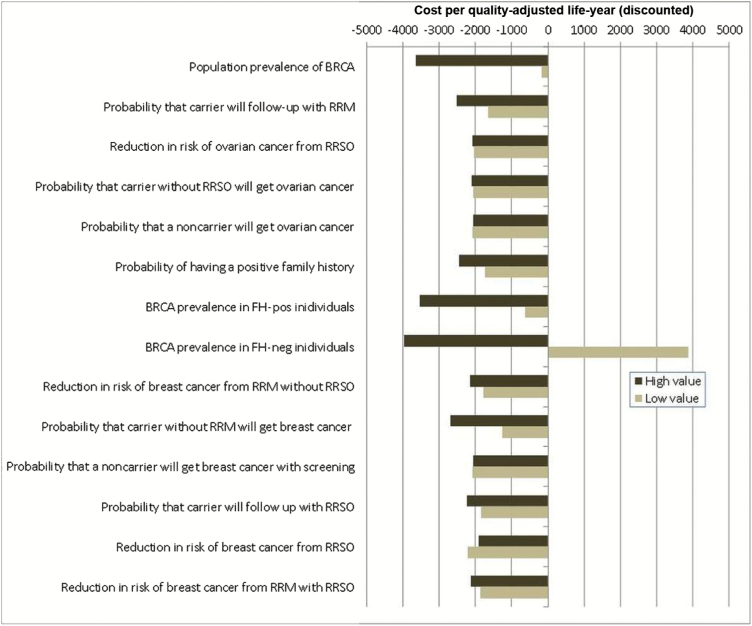
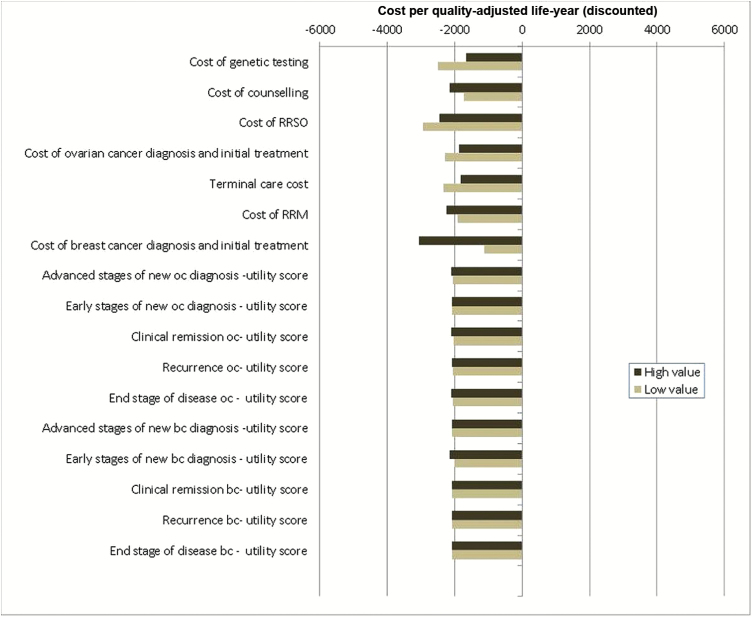
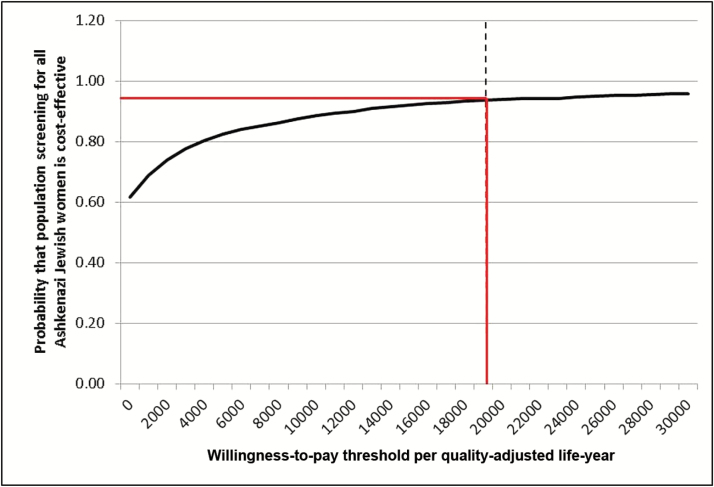
Results: Compared with FH-based testing, population-screening saved 0.090 more life-years and 0.101 more QALYs resulting in 33 days' gain in life expectancy. Population screening was found to be cost saving with a baseline-discounted ICER of -£2079/QALY. Population-based screening lowered ovarian and breast cancer incidence by 0.34% and 0.62%. Assuming 71% testing uptake, this leads to 276 fewer ovarian and 508 fewer breast cancer cases. Overall, reduction in treatment costs led to a discounted cost savings of £3.7 million. Deterministic sensitivity analysis and 94% of simulations on PSA (threshold £20000) indicated that population screening is cost-effective, compared with current NHS policy.

Conclusion: Population-based screening for BRCA mutations is highly cost-effective compared with an FH-based approach in AJ women age 30 years and older.


Figures

Figure 1.
Figure 1.
Decision model structure. The upper part of the model structure reflects a population-based approach to BRCA testing, and the lower part of the model depicts a family history (FH)–based approach. Each decision point in the model is called a “node,” and each path extending from a node is called a decision “branch.” Each branch represents a mutually exclusive course or outcome. Each decision is given a probability (probabilities p1 to p14 used in the model are explained in Table 1) highlighted in a white box along the decision branch. Values for each outcome are calculated. Cancer incidence was estimated by summing the probabilities of pathways ending in ovarian or breast cancer. Final outcomes (blue boxes on the right of the figure) of each path include development of breast cancer (BC), ovarian cancer (OC) and no breast/ovarian cancer (no OC or BC). BC = breast cancer; No OC or BC = no ovarian cancer or breast cancer developed; OC = ovarian cancer; RRSO = risk-reducing salpingo-oophorectomy; RRM = risk-reducing mastectomy.
Figure 2.
Figure 2.
Deterministic sensitivity analysis for model probabilities. One-way sensitivity analysis for all probabilities in terms of the incremental cost-effectiveness ratio (ICER) of population-based screening compared with a family history (FH)–based approach for BRCA testing. X-axis: ICER: cost (£) per quality-adjusted life-year (QALY) (discounted). Y-axis: probability parameters in the model. The model is run at both lower and upper values/limits of the 95% confidence interval or range of all probability parameters given in Table 1. “High value” represents outcomes for upper limit, and “Low value” represents outcomes for lower limit of the probability parameter. Outcomes to the left of the midline “0” value on the X-axis indicate that the model is cost saving. FH = family history; neg = negative; pos = positive; RRSO = risk-reducing salpingo-oophorectomy; RRM = risk-reducing mastectomy.
Figure 3.
Figure 3.
Deterministic sensitivity analysis for model costs and utilities. One-way sensitivity analysis for all model costs and utility-score parameters in terms of the incremental cost-effectiveness ratio (ICER) of population-based screening compared with a family history (FH)–based approach for BRCA testing. X-axis: ICER: cost (£s) per quality-adjusted life-year (QALY) (discounted). Y-axis: cost and utility-score parameters in the model. The model is run at both lower and upper values/limits of the cost and utility-score parameters given in Table 2. “High value” represents outcomes for upper limit, and “Low value” represents outcomes for lower limit of these parameters. Outcomes to the left of the midline “0” value on the X-axis indicate that the model is cost saving. This analysis suggests that variation in costs and utility scores do not statistically significantly affect model outcomes. BC = breast cancer; FH = family history; neg = negative; OC = ovarian cancer; pos = positive; RRSO = risk-reducing salpingo-oophorectomy; RRM = risk-reducing mastectomy.
Figure 4.
Figure 4.
Cost-effectiveness acceptability curve. Probabilistic sensitivity analysis in which all model parameters/variables are varied simultaneously across their distributions to further explore model uncertainty. X-axis: Incremental cost-effectiveness ratio in terms of cost (£s)/quality-adjusted life-year. Y-axis: proportion of simulations. The results of 1000 simulations were plotted on a cost-effectiveness acceptability curve showing the proportion of simulations (Y-axis), which indicated that the intervention was cost-effective at different willingness-to-pay thresholds (X-axis). The solid red line marks the proportion of simulations found to be cost-effective at the £20 000 threshold used by NICE. 94% simulations are cost-effective in this analysis.

Similar articles

Cited by

References

    1. Levy-Lahad E, Gabai-Kapara E, Kaufman B, et al. Identification of BRCA1/BRCA2 carriers by screening in the healthy population and its implications. In: American Society of Clinical Oncology, Annual meeting. J Clin Oncol. 2011;29(Suppl);abstr 1513.
    1. Hartge P, Struewing JP, Wacholder S, et al. The prevalence of common BRCA1 and BRCA2 mutations among Ashkenazi Jews. Am J Hum Genet. 1999;64(4):963–970. - PMC - PubMed
    1. Metcalfe KA, Poll A, Royer R, et al. Screening for founder mutations in BRCA1 and BRCA2 in unselected Jewish women. J Clin Oncol. 2010;28(3):387–391. - PubMed
    1. King MC, Marks JH, Mandell JB. Breast and ovarian cancer risks due to inherited mutations in BRCA1 and BRCA2. Science. 2003;302(5645):643–646. - PubMed
    1. Hopper JL, Southey MC, Dite GS, et al. Population-based estimate of the average age-specific cumulative risk of breast cancer for a defined set of protein-truncating mutations in BRCA1 and BRCA2. Australian Breast Cancer Family Study. Cancer Epidemiol Biomarkers Prev. 1999;8(9):741–747. - PubMed

Publication types

MeSH terms