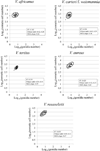
Distributions of reproductive and somatic cell numbers in diverse Volvox (Chlorophyta) species
- PMID: 25435818
- PMCID: PMC4244606
Distributions of reproductive and somatic cell numbers in diverse Volvox (Chlorophyta) species
Abstract
Background: Volvox (Chlorophyta) asexual colonies consist of two kinds of cells: a large number of small somatic cells and a few large reproductive cells. The numbers of reproductive and somatic cells correspond directly to the major components of fitness - fecundity and viability, respectively. Volvox species display diverse patterns of development that give rise to the two cell types.
Questions: For Volvox species under fixed conditions, do species differ with respect to the distribution of somatic and reproductive cell numbers in a population of asexual clones? Specifically, do they differ with respect to the dispersion of the distribution, i.e. with respect to their intrinsic variability? If so, are these differences related to major among-species developmental differences?
Data description: For each of five Volvox species, we estimate the number of somatic and reproductive cells for 40 colonies and the number of reproductive cells for an additional 200 colonies. We sampled all colonies from growing, low-density, asexual populations under standard conditions.
Search method: We compare the distribution of reproductive cell numbers to a Poisson distribution. We also compare the overall dispersion of reproductive cell number among species by calculating the coefficient of variation (CV). We compare the bivariate (reproductive and somatic cell) dataset to simulated datasets produced from a simple model of cell-type specification with intrinsic variability and colony size variation. This allows us to roughly estimate the level of intrinsic variability that is most consistent with our observed bivariate data (given an unknown level of size variation).
Conclusions: The overall variability (CV) in reproductive cell number is high in Volvox compared with more complex organisms. Volvox species show differences in reproductive cell number CV that were not clearly related to development, as currently understood. If we used the bivariate data and tried to account for the effects of colony size variation, we found that the species that have fast embryonic divisions and asymmetric divisions have substantially higher intrinsic variability than the species that have slow divisions and no asymmetric divisions. Under our culture conditions, the Poisson distribution is a good description of intrinsic variability in reproductive cell number for some but not all Volvox species.
Keywords: Volvox; cellular differentiation; development; eco-devo; evolution; multicellularity; reproductive allocation; robustness.
Figures


Similar articles
-
Major ontogenetic transitions during Volvox (Chlorophyta) evolution: when and where might they have occurred?Dev Genes Evol. 2016 Sep;226(5):349-54. doi: 10.1007/s00427-016-0557-0. Epub 2016 Jul 27. Dev Genes Evol. 2016. PMID: 27461033 Review.
-
Volvox: A simple algal model for embryogenesis, morphogenesis and cellular differentiation.Dev Biol. 2016 Nov 1;419(1):99-113. doi: 10.1016/j.ydbio.2016.07.014. Epub 2016 Jul 19. Dev Biol. 2016. PMID: 27451296 Free PMC article. Review.
-
[Volvox (Chlorophyta, Volvocales) as a model organism in developmental biology].Ontogenez. 2009 Jul-Aug;40(4):301-4. Ontogenez. 2009. PMID: 19705761 Review. Russian.
-
[Ontogenetic diversity of colonies and intercellular cytoplasmic bridges in the algae of the genuis Volvox].Ontogenez. 2014 Jul-Aug;45(4):280-4. Ontogenez. 2014. PMID: 25735150 Review. Russian.
-
The relationship between cell size and cell fate in Volvox carteri.J Cell Biol. 1993 Oct;123(1):191-208. doi: 10.1083/jcb.123.1.191. J Cell Biol. 1993. PMID: 8408198 Free PMC article.
Cited by
-
The evolution of mechanisms to produce phenotypic heterogeneity in microorganisms.Nat Commun. 2022 Jan 25;13(1):195. doi: 10.1038/s41467-021-27902-4. Nat Commun. 2022. PMID: 35078994 Free PMC article.
-
Stochastic developmental variation, an epigenetic source of phenotypic diversity with far-reaching biological consequences.J Biosci. 2015 Mar;40(1):159-204. doi: 10.1007/s12038-015-9506-8. J Biosci. 2015. PMID: 25740150 Review.
-
Division of labour in microorganisms: an evolutionary perspective.Nat Rev Microbiol. 2016 Nov;14(11):716-723. doi: 10.1038/nrmicro.2016.111. Epub 2016 Sep 19. Nat Rev Microbiol. 2016. PMID: 27640757 Review.
-
Evolution of irreversible somatic differentiation.Elife. 2021 Oct 13;10:e66711. doi: 10.7554/eLife.66711. Elife. 2021. PMID: 34643506 Free PMC article.
-
Evolution of reproductive strategies in incipient multicellularity.J R Soc Interface. 2022 Mar;19(188):20210716. doi: 10.1098/rsif.2021.0716. Epub 2022 Mar 2. J R Soc Interface. 2022. PMID: 35232276 Free PMC article.
References
-
- Abell A. Variation in clutch size and offspring size relative to environmental conditions in the lizard Sceloporus virgatus. J. Herpetol. 1999;33:173–180.
-
- Blake WJ, Kærn M, Cantor CR, Collins JJ. Noise in eukaryotic gene expression. Nature. 2003;422:633–637. - PubMed
-
- Brakefield PM. Evo-devo and constraints on selection. Trends Ecol. Evol. 2006;21:362–368. - PubMed
-
- Coleman AW. A comparative analysis of the Volvocaceae (Chlorophyta) J. Phycol. 2012;48:491–513. - PubMed
Grants and funding
LinkOut - more resources
Full Text Sources
