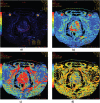
Perfusion CT is a valuable diagnostic method for prostate cancer: a prospective study of 94 patients
- PMID: 25435904
- PMCID: PMC4239130
- DOI: 10.3332/ecancer.2014.476
Perfusion CT is a valuable diagnostic method for prostate cancer: a prospective study of 94 patients
Abstract
Purpose: The aim of this study is to assess the usefulness of perfusion computer tomography (pCT) in prostate cancer (PCa) diagnostics.
Materials and methods: 94 patients with biopsy-proven PCa were enrolled in the study. Dynamic pCT of the prostate gland was performed for 50 seconds after an intravenous injection of contrast medium. Blood flow (BF), blood volume (BV), mean transit time (MTT) and permeability surface area product (PS) were computed in the suspected PCa area and in normal prostatic tissue.
Results: PCa was visible in pCT in 90 of the 94 examined patients as a focal peripheral CT enhancement. When PCa was located in the peripheral zone (PZ), it was visible on perfusion maps, mostly showing an early peak followed by wash-out. The average values of all perfusion parameters were higher for tumour than for normal prostate tissue (p < 0.000). BV and BF were dependent on tumour grade expressed by the Gleason score (GS). All PCa cases were divided into groups, according to histological grade, as low (GS ≤ 6), medium (GS = 7), and high (GS > 7). In high-grade PCa, the mean BF value was significantly higher (p = 0.001) than the mean value of BF low- and medium-grade PCa (p = 0.011). Similar results were obtained regarding the mean values of BV; the more aggressive the cancer grade, the higher the mean BV value (p = 0.04).
Conclusion: CT quantitative perfusion imaging allows PCa to be distinguished from normal prostate tissue. The highest values for BF and BV were observed in the most aggressive PCa grade.
Keywords: angiogenesis; perfusion CT; prostate cancer.
Figures


References
-
- Gupta RT, et al. The state of prostate MRI in 2013. Oncology (Williston Park) 2013;27(4):262–70. - PubMed
LinkOut - more resources
Full Text Sources
Other Literature Sources
Miscellaneous
