. 2014 Aug 27;7(1):126.
doi: 10.1186/s13068-014-0126-6. eCollection 2014.

Leveraging transcription factors to speed cellobiose fermentation by Saccharomyces cerevisiae

Affiliations

Leveraging transcription factors to speed cellobiose fermentation by Saccharomyces cerevisiae

Yuping Lin et al. Biotechnol Biofuels. .

Abstract

Background: Saccharomyces cerevisiae, a key organism used for the manufacture of renewable fuels and chemicals, has been engineered to utilize non-native sugars derived from plant cell walls, such as cellobiose and xylose. However, the rates and efficiencies of these non-native sugar fermentations pale in comparison with those of glucose. Systems biology methods, used to understand biological networks, hold promise for rational microbial strain development in metabolic engineering. Here, we present a systematic strategy for optimizing non-native sugar fermentation by recombinant S. cerevisiae, using cellobiose as a model.

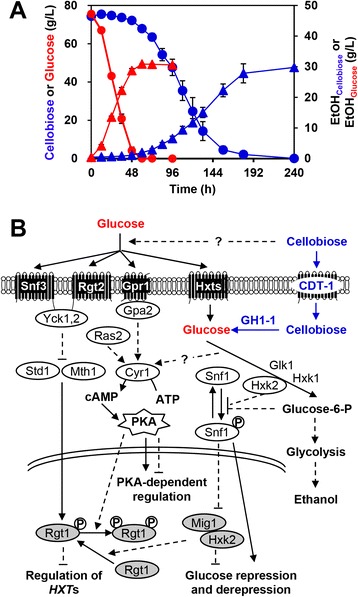
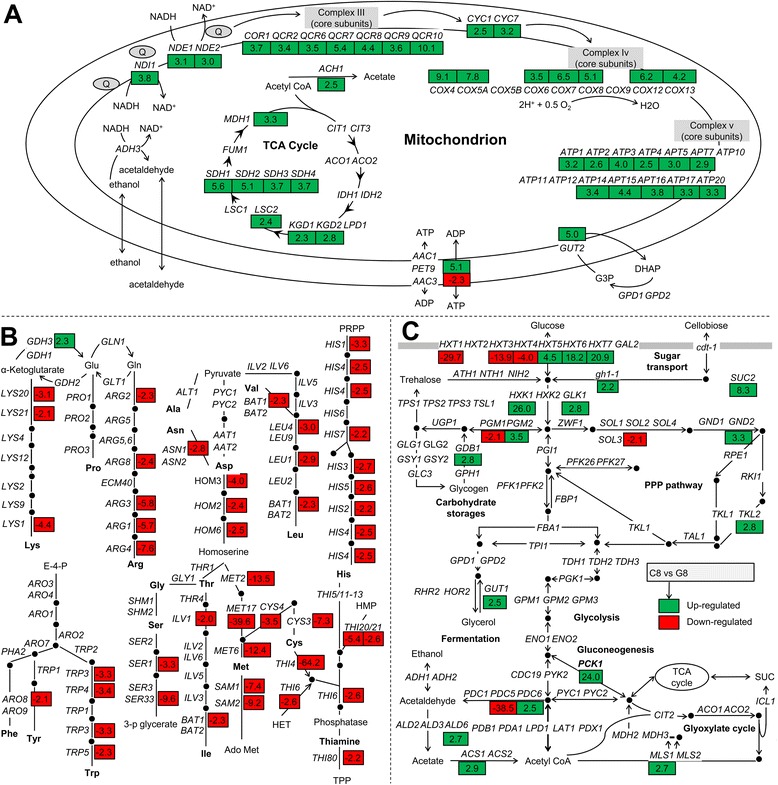
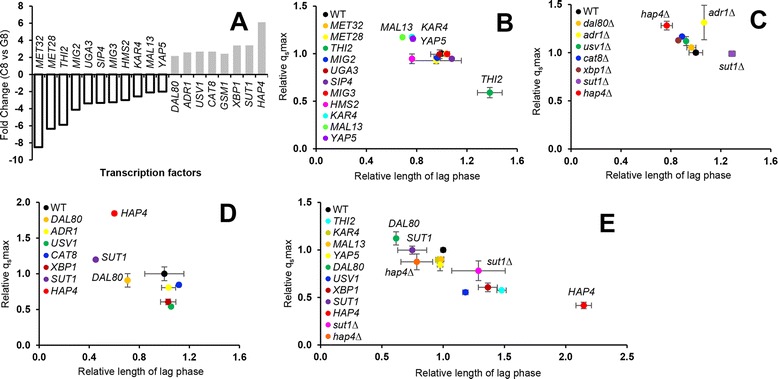
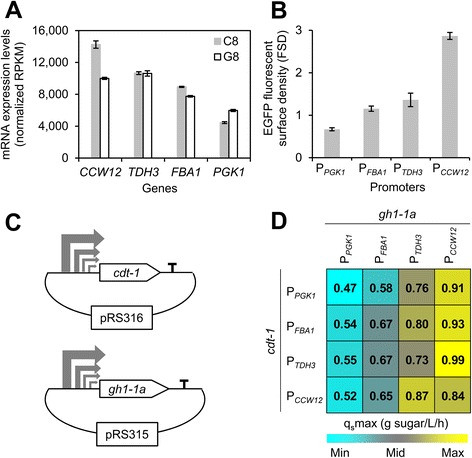
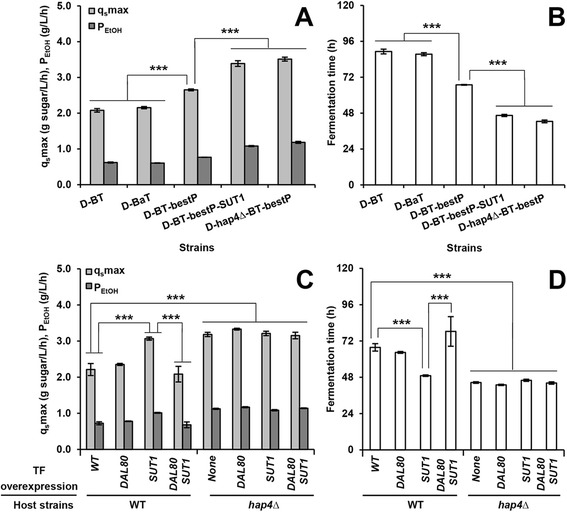
Results: Differences in gene expression between cellobiose and glucose metabolism revealed by RNA deep sequencing indicated that cellobiose metabolism induces mitochondrial activation and reduces amino acid biosynthesis under fermentation conditions. Furthermore, glucose-sensing and signaling pathways and their target genes, including the cAMP-dependent protein kinase A pathway controlling the majority of glucose-induced changes, the Snf3-Rgt2-Rgt1 pathway regulating hexose transport, and the Snf1-Mig1 glucose repression pathway, were at most only partially activated under cellobiose conditions. To separate correlations from causative effects, the expression levels of 19 transcription factors perturbed under cellobiose conditions were modulated, and the three strongest promoters under cellobiose conditions were applied to fine-tune expression of the heterologous cellobiose-utilizing pathway. Of the changes in these 19 transcription factors, only overexpression of SUT1 or deletion of HAP4 consistently improved cellobiose fermentation. SUT1 overexpression and HAP4 deletion were not synergistic, suggesting that SUT1 and HAP4 may regulate overlapping genes important for improved cellobiose fermentation. Transcription factor modulation coupled with rational tuning of the cellobiose consumption pathway significantly improved cellobiose fermentation.

Conclusions: We used systems-level input to reveal the regulatory mechanisms underlying suboptimal metabolism of the non-glucose sugar cellobiose. By identifying key transcription factors that cause suboptimal cellobiose fermentation in engineered S. cerevisiae, and by fine-tuning the expression of a heterologous cellobiose consumption pathway, we were able to greatly improve cellobiose fermentation by engineered S. cerevisiae. Our results demonstrate a powerful strategy for applying systems biology methods to rapidly identify metabolic engineering targets and overcome bottlenecks in performance of engineered strains.

Keywords: Biofuels; Cellobiose; Glycolysis; Metabolic engineering; Systems biology; Transcription factor.


Figures

Figure 1
Figure 1
Suboptimal cellobiose metabolism in engineered Saccharomyces cerevisiae . (A) Fermentation profiles of recombinant cellobiose-utilizing S. cerevisiae with plasmid pRS426-BT on cellobiose or glucose in anaerobic conditions with an initial OD600 of 1. Concentrations: cellobiose (blue circle), glucose (red circle), ethanol from cellobiose (blue triangle), and ethanol from glucose (red triangle). Data represent the mean and standard error of triplicate cultures grown on each source. The arrows indicate the times at which samples were taken for transcription profiling by RNA deep sequencing. (B) Model of the regulation of glucose metabolism and of glucose-sensing and signaling networks in the context of a cellobiose-utilizing pathway. The cellobiose-utilizing pathway was established in S. cerevisiae by introducing a cellodextrin transporter gene (cdt-1) and an intracellular β-glucosidase gene (gh1-1) from Neurospora crassa. Gpr1 and Gpa2 define a glucose-sensing pathway that works in parallel with Ras2 to activate protein kinase A (PKA), which induces genome-wide regulation. Signals emanating from Snf3 and Rgt2 regulate hexose transporter genes by inactivating the Rgt1 co-repressors Mth1 and Std1. The glucose repression signal that inactivates Snf1 kinase is generated through glucose metabolism, consequently inducing the Mig1/Hxk2-mediated glucose repression pathway. In addition, Snf1 kinase directly mediates phosphorylation of transcription activators of glucose-repressed genes to relieve glucose repression.
Figure 2
Figure 2
Impact of cellobiose on central carbon metabolism, amino acid biosynthesis and thiamine biosynthesis of Saccharomyces cerevisiae . (A) Genes involved in mitochondrial function, including the tricarboxylic acid (TCA) cycle, electron transport chain, and oxidative phosphorylation are shown. (B) Genes involved in amino acid and thiamine biosynthesis. (C) Genes involved in sugar transport, glycolysis and fermentation, the pentose phosphate pathway, gluconeogenesis, storage of carbohydrates (trehalose and glycogen), and the glyoxylate cycle. (A–C) Only genes with significantly different expression when comparing cellobiose-grown versus glucose-grown cells are shown (color-coded boxes), including the fold change on cellobiose (C8) versus glucose (G8). Transcription levels that significantly increased or decreased on cellobiose in contrast to glucose (absolute fold changes ≥2.0, P ≤ 0.001) are shown in green and red boxes, respectively.
Figure 3
Figure 3
The effect of manipulating transcription factors (TFs) on cellobiose fermentation. (A) TFs with significantly different expression levels on cellobiose versus glucose. For all TFs shown, P-values were well below 0.001 (see Additional file 2: Dataset S2). (B) Cellobiose fermentation profiles of TFs overexpressed in strain BY4742. The TFs chosen for overexpression were those downregulated in cellobiose in the wild-type (WT) strain. The relative cellobiose-consumption rate (qsmax) and the relative length of the lag phase [100,101] were obtained by comparisons WT controls (normalized to 1.0). (C) Cellobiose fermentation profiles of deletion strains in BY4742 background for TFs upregulated in cellobiose versus glucose in (A). (D) Cellobiose fermentation profiles of strains overexpressing TFs upregulated on cellobiose versus glucose in (A). (E) Cellobiose fermentation profiles using TF mutants in strain D452-2. Because D452-2, which is another laboratory strain of S. cerevisiae, seems to have comparable fermentation performance to industrial strains, this strain has attracted attention as a host strain to express foreign sugar-utilizing pathways. In all of the above panels, the cellobiose-consumption pathway was expressed from plasmid pRS316-BT. For panels (B-E), plots of relative qsmax versus relative length of the lag time are shown. Each point represents duplicate anaerobic fermentations using a starting cellobiose concentration of 80 g/l and starting OD600 of 1. The maximum cellobiose-consumption rate and length of the lag phase were 1.22 ± 0.09 g/l/h and 74.28 ± 3.70 h, respectively, for the WT BY4742 strain, and 1.18 ± 0.00 g/l/h and 58.32 ± 2.77 h for the WT D452-2 strain.
Figure 4
Figure 4
Promoter engineering to optimize expression of the heterologous cellobiose-utilizing pathway. (A) Identification of strong promoters from transcription profiling of cellobiose-grown (C8) and glucose-grown (G8) cultures. (B) Verification of promoter strengths by measuring green fluorescent protein (GFP) fluorescence using flow cytometry. Anaerobically grown cells on cellobiose were harvested at mid-exponential phase and analyzed. The cell surface density of enhanced green fluorescent protein (eGFP)-tagged CDT-1 is shown. (C) Construction of a promoter library of 4 promoters and 2 gesnes for expression of the cellobiose-utilization pathway. The plasmids pRS316 (CEN URA) and pRS315 (CEN LEU) were used to express cdt-1 and a codon-optimized version of N. crassa gh1-1 (gh1-1a), respectively. (D) Comparison of cellobiose-consumption rates (qsmax) using strains expressing the cellobiose-utilization pathway from the promoter library. The starting OD600 of 1 was used. The promoters for each gene are shown, and the rates are color-coded by relative rates. Fermentation parameters were calculated from the fermentation profiles in Fig. S4D.
Figure 5
Figure 5
Comparisons of cellobiose fermentation using strain D452-2 with the original (P PGK1 -driven cdt-1 and gh1-1a ) and optimized (P TDH3 -driven cdt-1 and P CCW12 -driven gh1-1a ) cellobiose-utilizing pathways and transcription factor (TF) mutants. (A) Cellobiose-consumption rates and ethanol productivities with strains expressing the original and optimized cellobiose-utilization pathways, and also either overexpressing SUT1 or harboring a hap4 deletion. For details of the strains, see Additional file 4: Table S1. (B) Fermentation times of the strains in (A). (C) Comparisons of cellobiose-consumption rates and ethanol productivities with WT D452-2 or D452-2 (hap4Δ) expressing the optimized cellobiose-utilization pathway, and additionally overexpressing SUT1 and/or DAL80. (D) Fermentation times of the strains in (C), defined as the time when ethanol reached its maximum titer. In all experiments in (A–D), an initial OD600 of 20 was used. Data represent the mean and standard error of triplicate cultures on each source. Statistical analysis in (A) and (C) was performed using two-way ANOVA (with strains and fermentation rate including qsmax and PEtOH as the factors) followed by Tukey’s multiple-comparison posttest (***P < 0.001). Statistical analysis in (B) and (D) was performed using one-way ANOVA followed by Tukey’s multiple-comparison posttest (***P < 0.001).

Similar articles

Cited by

References

    1. Coulier L, Zha Y, Bas R, Punt PJ. Analysis of oligosaccharides in lignocellulosic biomass hydrolysates by high-performance anion-exchange chromatography coupled with mass spectrometry (HPAEC-MS) Bioresour Technol. 2013;133:221–231. doi: 10.1016/j.biortech.2013.01.085. - DOI - PubMed
    1. Kim SR, Ha SJ, Wei N, Oh EJ, Jin YS. Simultaneous co-fermentation of mixed sugars: a promising strategy for producing cellulosic ethanol. Trends Biotechnol. 2012;30:274–282. doi: 10.1016/j.tibtech.2012.01.005. - DOI - PubMed
    1. Hong KK, Nielsen J. Metabolic engineering of Saccharomyces cerevisiae: a key cell factory platform for future biorefineries. Cell Mol Life Sci. 2012;69:2671–2690. doi: 10.1007/s00018-012-0945-1. - DOI - PMC - PubMed
    1. Dellomonaco C, Fava F, Gonzalez R. The path to next generation biofuels: successes and challenges in the era of synthetic biology. Microb Cell Factories. 2010;9:3. doi: 10.1186/1475-2859-9-3. - DOI - PMC - PubMed
    1. Galazka JM, Tian C, Beeson WT, Martinez B, Glass NL, Cate JH. Cellodextrin transport in yeast for improved biofuel production. Science. 2010;330:84–86. doi: 10.1126/science.1192838. - DOI - PubMed