. 2014 Sep 1;7(3):293-306.
doi: 10.1007/s12195-014-0342-y.

Nuclear deformability constitutes a rate-limiting step during cell migration in 3-D environments

Affiliations

Nuclear deformability constitutes a rate-limiting step during cell migration in 3-D environments

Patricia M Davidson et al. Cell Mol Bioeng. .

Abstract

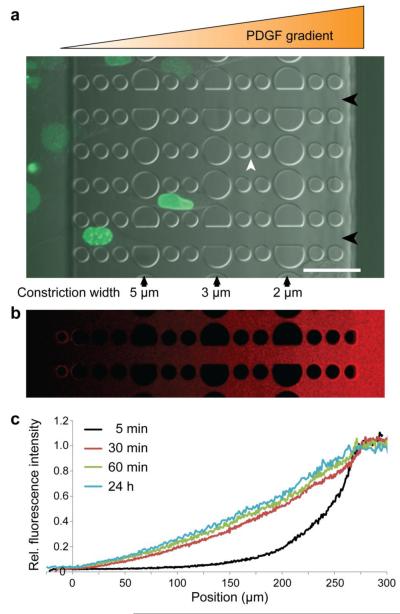
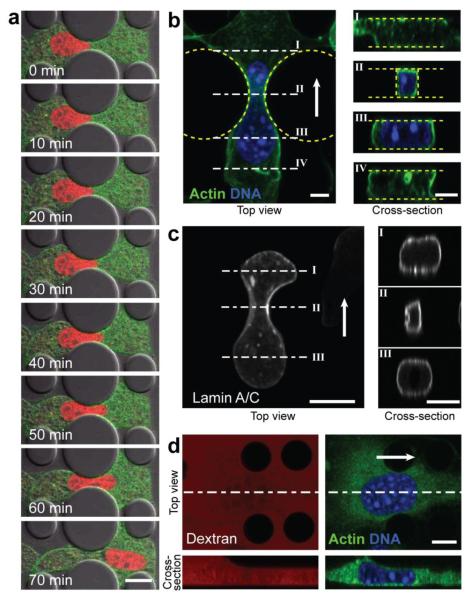
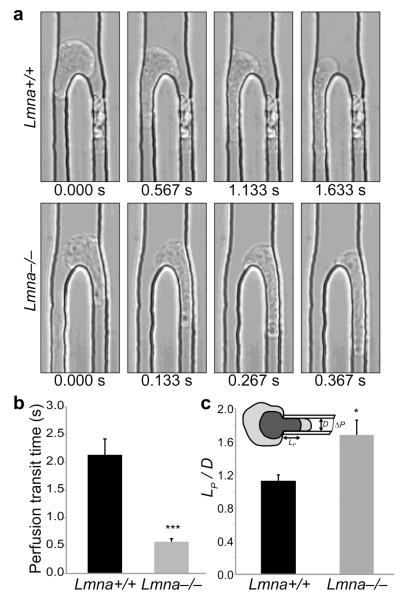
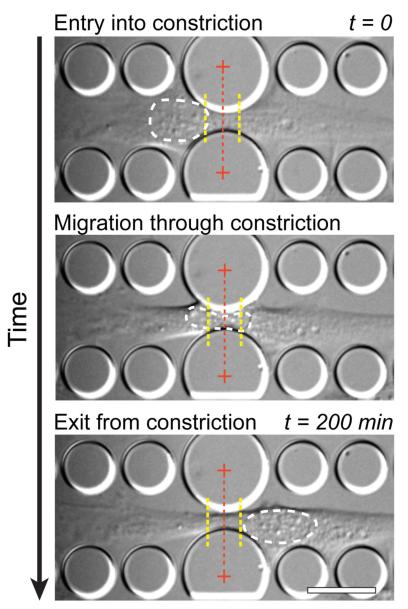
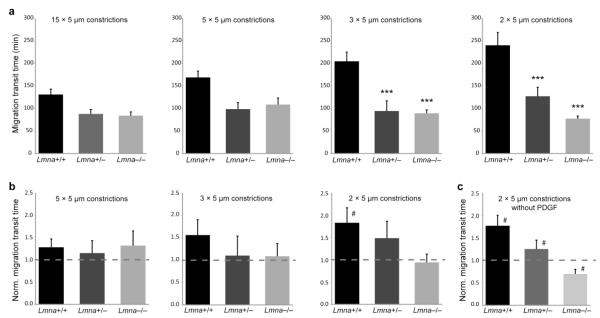
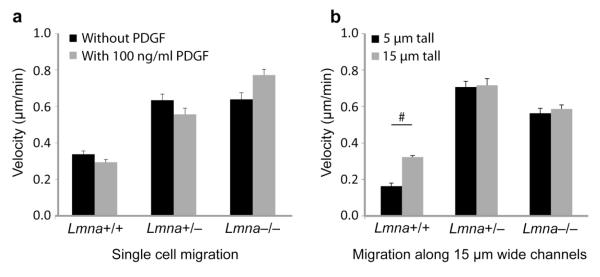
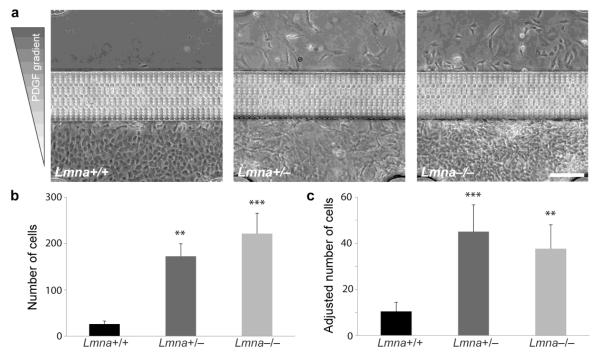
Cell motility plays a critical role in many physiological and pathological settings, ranging from wound healing to cancer metastasis. While cell migration on 2-dimensional (2-D) substrates has been studied for decades, the physical challenges cells face when moving in 3-D environments are only now emerging. In particular, the cell nucleus, which occupies a large fraction of the cell volume and is normally substantially stiffer than the surrounding cytoplasm, may impose a major obstacle when cells encounter narrow constrictions in the interstitial space, the extracellular matrix, or small capillaries. Using novel microfluidic devices that allow observation of cells moving through precisely defined geometries at high spatial and temporal resolution, we determined nuclear deformability as a critical factor in the cells' ability to pass through constrictions smaller than the size of the nucleus. Furthermore, we found that cells with reduced levels of the nuclear envelope proteins lamins A/C, which are the main determinants of nuclear stiffness, passed significantly faster through narrow constrictions during active migration and passive perfusion. Given recent reports that many human cancers have altered lamin expression, our findings suggest a novel biophysical mechanism by which changes in nuclear structure and composition may promote cancer cell invasion and metastasis.

Keywords: Lamin; cancer; invasion; mechanics; metastasis; microfluidics; microstructures; nuclear envelope; nucleus.


Figures

Figure 1
Figure 1. Overview of the microfluidic migration device
a) Cells are seeded in a 250 μm tall chamber of the device (far left), which is separated from the other chamber (far right) by 5 μm tall constriction channels consisting of PDMS pillars. Larger pillars create a series of 5 μm, 3 μm, and 2 μm wide constrictions (black arrows). In the direction perpendicular to the gradient, 2 wide spacings between pillars (white arrowhead) allow the gradient to form uniformly even when cells are inside the constriction channels. Channels with wider spacing (15 μm, black arrowheads) are provided to assess the cell migration speed without nuclear confinement. Shown here are human skin fibroblasts expressing GFP-lamin A migrating through a device towards a PDGF chemotactic gradient. Scale bar: 50 μm. b) Gradient formation after 24 hours of fluorescently labeled (Texas Red) 70 kD dextran. c) Fluorescence intensity across the migration device during gradient formation with 70 kD fluorescent dextran, demonstrating that the gradient forms quickly (within 30 minutes) and is stable over 24 hours.
Figure 2
Figure 2. Nuclear deformation during migration through narrow constrictions
a) Time-lapse image sequence of NIH 3T3 cells expressing fluorescently tagged Histone-4 (red) and actin (green) migrating through a 3 μm wide constriction, revealing substantial nuclear deformation. Scale bar: 20 μm. b) Top-view and cross-sections of a confocal 3-D reconstruction of a cell migrating through a 3 μm-wide constriction, stained for DNA (blue) and F-actin (green). The cross-sections (right) demonstrate that the cell takes up the entire height of the device and that the nucleus fills out the constriction. Scale bar: 5 μm. White arrow denotes direction of migration. c) Confocal 3-D reconstruction of a cell expressing GFP-lamin A migrating through a 2 μm-wide constriction. The cross-section through the constriction (II) suggests compression and buckling of the nuclear lamina inside the constriction. Scale bar: 5 μm. d) Confocal top- and side-view of a single cell entering the 5 μm tall constriction channel inside the migration device. The channels were filled with fluorescently labeled dextran (red; left images) and cells were stained for DNA (blue) and expressed fluorescent actin (green). As the cell enters the 5 μm tall channel, the cell and nuclear height adjusts to the available height of the channel (compare bottom left and right images). Scale bar: 10 μm.
Figure 3
Figure 3. Lamin A/C-deficient cells have more deformable nuclei
a) Representative images from high-speed time-lapse videos of cells being perfused through 5 μm wide microfluidic constriction channels, revealing that wild-type cells (Lmna+/+) take substantially longer to enter and move through the constriction channel than lamin A/C-deficient (Lmna−/−) cells. b) Perfusion transit times through 5 μm constriction channels in the perfusion experiments. N = 167 cells for Lmna+/+, 236 for Lmna−/−; ***, P < 0.0001. c) Micropipette aspiration measurements on wild-type and lamin A/C-deficient cells, demonstrating that lamin A/C-deficient cells have more deformable nuclei. The nuclear elasticity is inversely proportional to the ratio of the aspirated nuclear length, LP, and the micropipette diameter, D. N = 17 cells for Lmna+/+, 18 for Lmna−/−; *, P = 0.0105.
Figure 4
Figure 4. Experimental approach to quantify the migration transit times of the nucleus through the narrow constrictions
Time-lapse image sequences were used to measure the amount of time between when the cell nucleus enters and exits the constriction. In this example, a Lmna+/+ mouse embryonic fibroblast is shown. Entry into the constriction is defined as the time point at which the cell nucleus crosses a threshold (left yellow dotted line) located 5 μm in front of the constriction center; the nucleus is defined as having exited the constriction when the back of the nucleus crosses a threshold 5 μm past the center of the constriction (right yellow dotted line). The white dashed line indicates the outline of the nucleus for demonstration purposes. The center of the constriction is marked with a red dashed line. See Supplemental Data for representative time-lapse microscopy sequences of Lmna+/+, Lmna+/− and Lmna−/− cells. Scale bar: 20 μm.
Figure 5
Figure 5. Reduced lamin A/C levels facilitate migration through narrow constrictions
a) Migration transit times for Lmna+/+, Lmna+/− and Lmna−/− cells migrating through constrictions 15, 5, 3, or 2 μm wide and 5 μm tall. Wild-type (Lmna+/+) cells take significantly longer to pass through the 2 × 5 μm2 and 3 × 5 μm2 constrictions than cells with reduced lamin A/C levels. For wild-type cells, but not Lmna+/− and Lmna−/− cells, migration transit times were negatively correlated with constriction size (P < 0.01). N = 24 to 41 cells per genotype, constriction; ***, P < 0.001 compared to Lmna+/+ cells. b) Migration transit times through narrow constrictions normalized to the corresponding migration transit times through 15 μm-wide channels, which are larger than the nucleus. Wild-type cells have impaired migration efficiency through the smallest constrictions, indicated by increased normalized migration transit times, while cells with reduced levels of lamins A/C maintain comparable migration transit times for all constriction sizes. N = 24 to 41 cells per genotype, constriction; #, P < 0.05 compared to migration transit times through 15 μm channels. c) Migration transit times through 2 × 5 μm2 constrictions normalized to the 15 μm channels without the presence of a chemoattractant gradient; #, P < 0.05 compared to migration transit times through 15 μm channels.
Figure 6
Figure 6. Cell migration velocity in unconfined conditions
a) Single cell migration analysis of mouse embryonic fibroblasts migrating on 2-D fibronectin-coated glass substrates, indicating that wild-type (Lmna+/+) mouse embryonic fibroblasts migrate slower than Lmna+/− and Lmna−/− cells. PDGF stimulation had no significant effect on migration velocity. b) Migration velocity in the direction of a chemoattractant (PDGF) gradient in 15 μm wide channels with heights of 5 μm (3-D migration) or 15 μm (2.5-D migration). Consistent with the 2-D migration experiments, wild-type cells moved more slowly than the lamin A/C-deficient cells; unlike the lamin A/C-deficient cells, wild-type cells had impeded migration speeds in the 5 μm tall channels compared to the 15 μm tall channels, indicating a possible effect of partial nuclear compression (Fig. 2D).
Figure 7
Figure 7. Cells with reduced levels of lamin A/C migrate through narrow constrictions more efficiently
a) Representative images of migration devices after 48 hours of migration, revealing increased numbers of Lmna+/− and Lmna−/− cells that have passed through the constrictions. b) Quantitative analysis of cell numbers that have passed through the channels after 48 hours. Cells with a reduced expression of lamins A/C had significantly larger numbers than wild-type cells. c) Cell numbers were adjusted for the different proliferation rates between cell lines. The adjusted data confirmed that cells with reduced levels of lamins A/C were more efficient at migrating through the narrow constrictions. N = 8 (from three independent experiments); **, P < 0.01, ***, P < 0.001, compared to Lmna+/+ cells. Scale bar: 200 μm.

References

    1. Chaffer CL, Weinberg RA. A perspective on cancer cell metastasis. Science. 2011;331(6024):1559–64. - PubMed
    1. Balzer EM, Tong Z, Paul CD, Hung WC, Stroka KM, Boggs AE, Martin SS, Konstantopoulos K. Physical confinement alters tumor cell adhesion and migration phenotypes. FASEB J. 2012;26(10):4045–56. - PMC - PubMed
    1. Hung WC, Chen SH, Paul CD, Stroka KM, Lo YC, Yang JT, Konstantopoulos K. Distinct signaling mechanisms regulate migration in unconfined versus confined spaces. J Cell Biol. 2013;202(5):807–24. - PMC - PubMed
    1. Friedl P, Wolf K. Plasticity of cell migration: a multiscale tuning model. J Cell Biol. 2010;188(1):11–9. - PMC - PubMed
    1. Petrie RJ, Yamada KM. At the leading edge of three-dimensional cell migration. J Cell Sci. 2012;125(Pt 24):5917–26. - PMC - PubMed

LinkOut - more resources