

A circulating subpopulation of monocytic myeloid-derived suppressor cells as an independent prognostic/predictive factor in untreated non-small lung cancer patients
- PMID: 25436215
- PMCID: PMC4243712
- DOI: 10.1155/2014/659294
A circulating subpopulation of monocytic myeloid-derived suppressor cells as an independent prognostic/predictive factor in untreated non-small lung cancer patients
Abstract
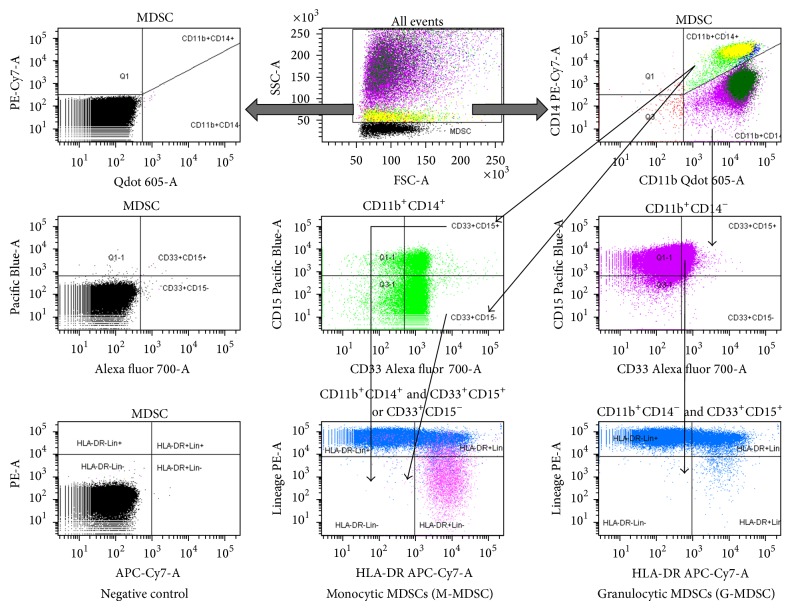
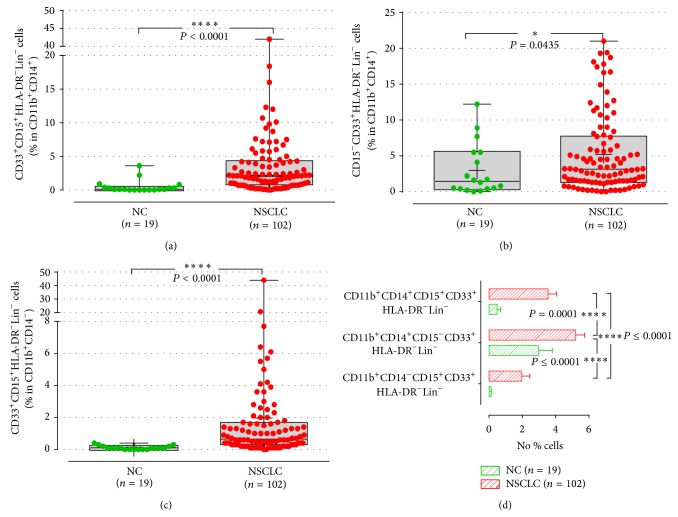
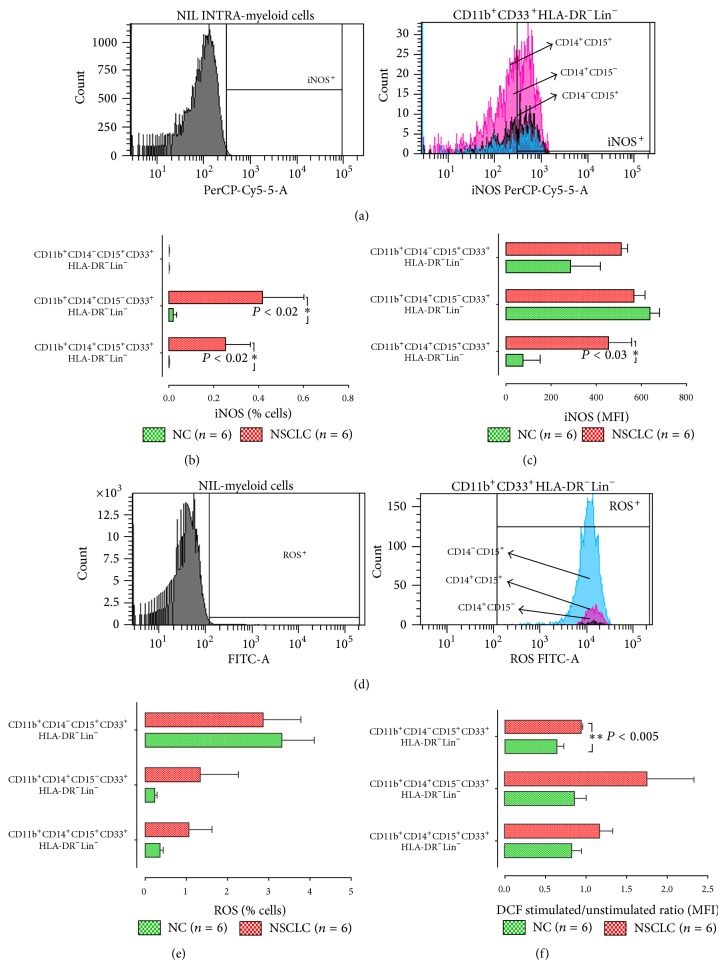
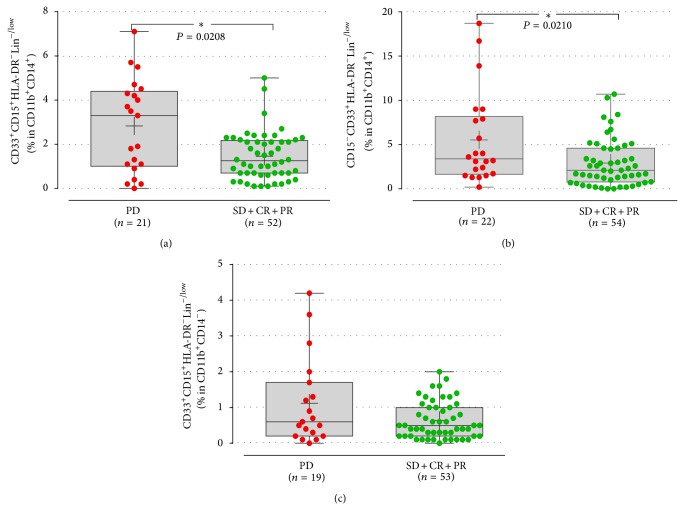
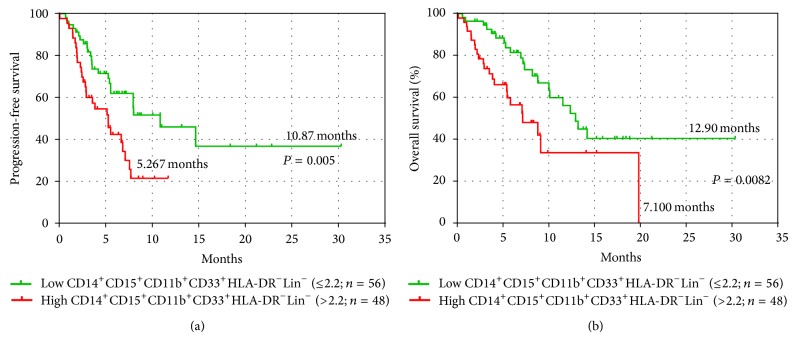
Myeloid-derived suppressor cells (MDSCs) represent a heterogeneous population of cells with immunosuppressive properties and might confer to worse prognosis in cancer patients. The presence of phenotypically newly described subpopulations of MDSCs and their association with the clinical outcome were investigated in non-small cell lung cancer (NSCLC) patients. The percentages and correlation between MDSCs and distinct immune cells in the peripheral blood of 110 chemotherapy-naive patients before treatment and healthy controls were investigated using flow cytometry. Two monocytic [CD14(+)CD15(-)CD11b(+)CD33(+)HLA-DR(-)Lin(-) and CD14(+)CD15(+)CD11b(+)CD33(+)HLA-DR(-)Lin(-)] and a granulocytic [CD14(-)CD15(+)CD11b(+)CD33(+)HLA-DR(-)Lin(-)] subpopulations of MDSCs were identified, expressing inducible nitric oxide synthase, and reactive oxygen species, respectively. Increased percentages of both monocytic-MDSCs' subpopulations were inversely correlated to dendritic/monocyte levels (P ≤ 0.04), while granulocytic-MDSCs were inversely correlated to CD4(+) T cells (P = 0.006). Increased percentages of monocytic-MDSCs were associated with worse response to treatment (P = 0.02) and patients with normal levels of CD14(+)CD15(+)CD11b(+)CD33(+)HLA-DR(-)Lin(-) had longer overall survival and progression free-survival compared to those with high levels (P = 0.008 and P = 0.005, resp.). Multivariate analysis revealed that the increased percentages of CD14(+)CD15(+)CD11b(+)CD33(+)HLA-DR(-)Lin(-) MDSCs were independently associated with decreased progression free-survival and overall survival. The data provide evidence that increased percentages of new monocytic-MDSCs' subpopulations in advanced NSCLC patients are associated with an unfavourable clinical outcome.
Figures
Similar articles
-
Population alterations of L-arginase- and inducible nitric oxide synthase-expressed CD11b+/CD14⁻/CD15+/CD33+ myeloid-derived suppressor cells and CD8+ T lymphocytes in patients with advanced-stage non-small cell lung cancer.J Cancer Res Clin Oncol. 2010 Jan;136(1):35-45. doi: 10.1007/s00432-009-0634-0. J Cancer Res Clin Oncol. 2010. PMID: 19572148 Free PMC article.
-
Epithelial-to-mesenchymal Transition Heterogeneity of Circulating Tumor Cells and Their Correlation With MDSCs and Tregs in HER2-negative Metastatic Breast Cancer Patients.Anticancer Res. 2021 Feb;41(2):661-670. doi: 10.21873/anticanres.14817. Anticancer Res. 2021. PMID: 33517270
-
CD14(+)S100A9(+) monocytic myeloid-derived suppressor cells and their clinical relevance in non-small cell lung cancer.Am J Respir Crit Care Med. 2012 Nov 15;186(10):1025-36. doi: 10.1164/rccm.201204-0636OC. Epub 2012 Sep 6. Am J Respir Crit Care Med. 2012. PMID: 22955317 Free PMC article.
-
Myeloid-derived suppressors cells (MDSC) correlate with clinicopathologic factors and pathologic complete response (pCR) in patients with urothelial carcinoma (UC) undergoing cystectomy.Urol Oncol. 2018 Sep;36(9):405-412. doi: 10.1016/j.urolonc.2018.02.018. Epub 2018 Mar 30. Urol Oncol. 2018. PMID: 29606341 Review.
-
Insights into Myeloid-Derived Suppressor Cells in Inflammatory Diseases.Arch Immunol Ther Exp (Warsz). 2015 Aug;63(4):269-85. doi: 10.1007/s00005-015-0342-1. Epub 2015 May 20. Arch Immunol Ther Exp (Warsz). 2015. PMID: 25990434 Review.
Cited by
-
Myeloid-derived suppressor cells: Cancer, autoimmune diseases, and more.Oncotarget. 2022 Nov 17;13:1273-1285. doi: 10.18632/oncotarget.28303. Oncotarget. 2022. PMID: 36395389 Free PMC article. Review.
-
Blood Immune Cells as Biomarkers in Long-Term Surviving Patients with Advanced Non-Small-Cell Lung Cancer Undergoing a Combined Immune/Chemotherapy.Cancers (Basel). 2023 Oct 6;15(19):4873. doi: 10.3390/cancers15194873. Cancers (Basel). 2023. PMID: 37835567 Free PMC article.
-
Understanding the Differentiation, Expansion, Recruitment and Suppressive Activities of Myeloid-Derived Suppressor Cells in Cancers.Int J Mol Sci. 2020 May 20;21(10):3599. doi: 10.3390/ijms21103599. Int J Mol Sci. 2020. PMID: 32443699 Free PMC article. Review.
-
Targeting myeloid-derived suppressor cells for cancer therapy.Cancer Biol Med. 2021 Aug 17;18(4):992-1009. doi: 10.20892/j.issn.2095-3941.2020.0806. Cancer Biol Med. 2021. PMID: 34403220 Free PMC article. Review.
-
Monocytic myeloid-derived suppressor cells as a potent suppressor of tumor immunity in non-small cell lung cancer.Oncol Lett. 2016 Dec;12(6):4785-4794. doi: 10.3892/ol.2016.5273. Epub 2016 Oct 18. Oncol Lett. 2016. PMID: 28101225 Free PMC article.
References
Publication types
MeSH terms
Substances
LinkOut - more resources
Full Text Sources
Other Literature Sources
Medical
Research Materials
