. 2014 Dec 1;9(12):e113040.
doi: 10.1371/journal.pone.0113040. eCollection 2014.

Coupled protein diffusion and folding in the cell

Affiliations

Coupled protein diffusion and folding in the cell

Minghao Guo et al. PLoS One. .

Abstract

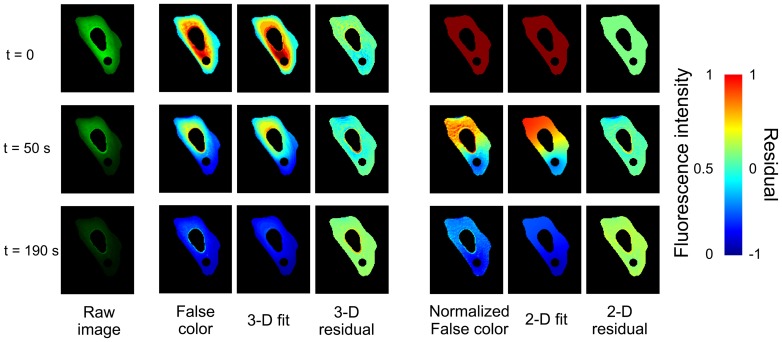
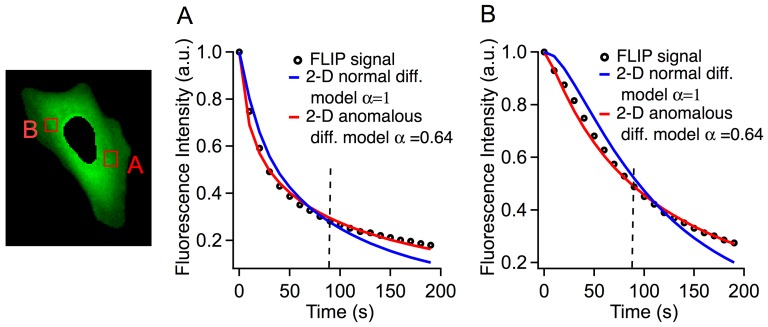
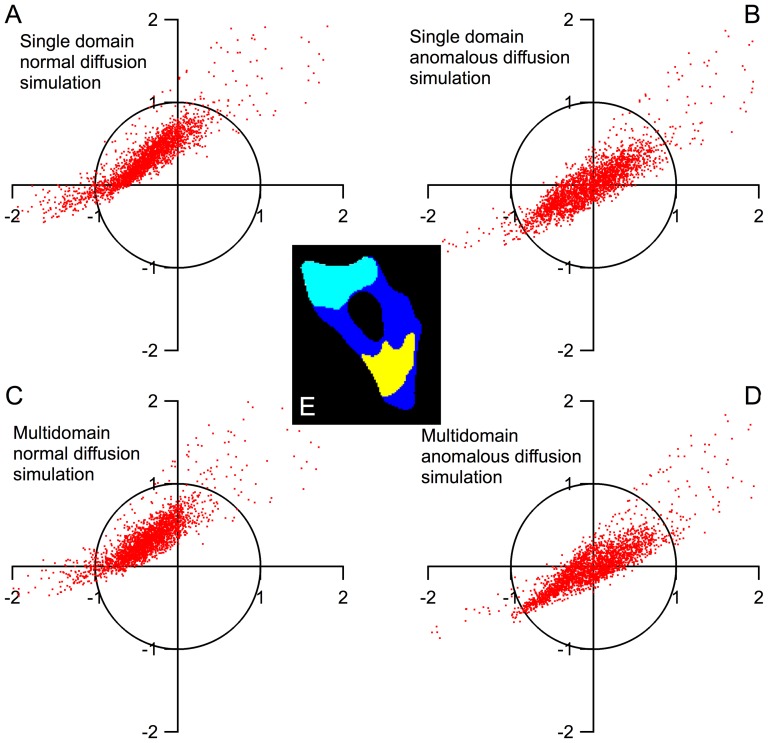
When a protein unfolds in the cell, its diffusion coefficient is affected by its increased hydrodynamic radius and by interactions of exposed hydrophobic residues with the cytoplasmic matrix, including chaperones. We characterize protein diffusion by photobleaching whole cells at a single point, and imaging the concentration change of fluorescent-labeled protein throughout the cell as a function of time. As a folded reference protein we use green fluorescent protein. The resulting region-dependent anomalous diffusion is well characterized by 2-D or 3-D diffusion equations coupled to a clustering algorithm that accounts for position-dependent diffusion. Then we study diffusion of a destabilized mutant of the enzyme phosphoglycerate kinase (PGK) and of its stable control inside the cell. Unlike the green fluorescent protein control's diffusion coefficient, PGK's diffusion coefficient is a non-monotonic function of temperature, signaling 'sticking' of the protein in the cytosol as it begins to unfold. The temperature-dependent increase and subsequent decrease of the PGK diffusion coefficient in the cytosol is greater than a simple size-scaling model suggests. Chaperone binding of the unfolding protein inside the cell is one plausible candidate for even slower diffusion of PGK, and we test the plausibility of this hypothesis experimentally, although we do not rule out other candidates.


Conflict of interest statement

Competing Interests: The authors have declared that no competing interests exist.

Figures

Figure 1
Figure 1. The instrument for FLIP measurements.
(A) The imaging LED and bleaching laser are combined to excite GFP or GFP-labeled proteins in the cell (ribbon structure of PGK at the top right). The LED illuminates the whole cell evenly for imaging. The laser is focused to a small intense spot (see Methods) to locally photobleach the fluorescent protein. (B) The LED and laser are controlled to turn on alternately every 10 seconds. Snapshots are taken with only the LED on to record the progress of the fluorescence intensity decay in the cell without saturating the camera.
Figure 2
Figure 2. Snapshots of the GFP fluorescence intensity at three of the 19 time steps sampled during bleaching in U2OS cells.
Left column: FLIP data in true color; the small bleaching spot and nucleus are excluded from analysis. Middle three columns: FLIP data in false color for better contrast (scale bar at right), 3-D diffusion model fit, and fit residual. Rightmost three columns: Same FLIP data in false color normalized to the fluorescence intensity distribution at t = 0, 2-D diffusion model fit, and fit residual.
Figure 3
Figure 3. Comparison of experimental data with 2-D normal and anomalous diffusion models at the two locations in the cell (A) and (B).
The experimental fluorescence intensity (black circles) initially decays faster, and subsequently slower than the best normal diffusion model fits (blue curves). Only anomalous diffusion with α<1 (red curves) correctly simulates the observed data. The vertical dashed lines at 85 s indicate where the short time (horizontal axis in Figure 4) and long time (vertical axis in Figure 4) residuals were calculated. The normal diffusion model tends to have a negative residual at short time and a positive residual at long time, whereas the anomalous diffusion model has much smaller residuals.
Figure 4
Figure 4. The distribution of the residuals of all the pixels in the cell.
(A–E) Single and multi-domain models of normal and anomalous diffusion simulations. The pixels represent the residual of a single pixel in the cell at t≤90 s (x-axis) and t≥100 s (y-axis). Normal diffusion simulations (A,C) have systematic deviation from experiment results, visualized by an offset in the residual graph. In the anomalous diffusion simulations (B,D), the multi-domain model results in smaller overall residuals than the single domain model. (E) The illustration of the three domains in the cell calculated by the k-means clustering algorithm.
Figure 5
Figure 5. Comparison of the diffusion coefficients of the GFP, ltPGK-GFP and ltPGK-FRET measured from 22°C to 37°C.
All proteins diffuse faster at higher temperatures while folded. The “lt” proteins show accelerated diffusion followed by a turnaround at T near T m. Global model fits are to equation 1 (solid thick lines) and equation 2 (dotted thick lines).
Figure 6
Figure 6. Donor over acceptor (D/A) ratios for protein unfolding and protein-protein interaction.
PGK-FRET unfolding (gray) has a midpoint at approximately 42°C for the U2OS cell data shown here, unfolding begins at 37°C. ltPGK-FRET starts interacting with Hsp70-mCherry extensively above 35°C, whereas htPGK-FRET simply continues the room temperature linear trend up to 45°C.

References

    1. McGuffee SR, Elcock AH (2010) Diffusion, crowding & protein stability in a dynamic molecular model of the bacterial cytoplasm. PLoS Comput Biol 6:e1000694. - PMC - PubMed
    1. Konopka MC, Shkel IA, Cayley S, Record MT, Weisshaar JC (2006) Crowding and confinement effects on protein diffusion in vivo. J Bacteriol 188:6115–6123. - PMC - PubMed
    1. Dix JA, Verkman AS (2008) Crowding effects on diffusion in solutions and cells. Annu Rev Biophys 37:247–263. - PubMed
    1. Capoulade J, Wachsmuth M, Hufnagel L, Knop M (2011) Quantitative fluorescence imaging of protein diffusion and interaction in living cells. Nat Biotechnol 29:835–839. - PubMed
    1. Schlimpert S, Klein Eric A, Briegel A, Hughes V, Kahnt J, et al. (2012) General Protein Diffusion Barriers Create Compartments within Bacterial Cells. Cell 151:1270–1282. - PMC - PubMed

Publication types

Substances