

Assessing sensor accuracy for non-adjunct use of continuous glucose monitoring
- PMID: 25436913
- PMCID: PMC4346608
- DOI: 10.1089/dia.2014.0272
Assessing sensor accuracy for non-adjunct use of continuous glucose monitoring
Abstract
Background: The level of continuous glucose monitoring (CGM) accuracy needed for insulin dosing using sensor values (i.e., the level of accuracy permitting non-adjunct CGM use) is a topic of ongoing debate. Assessment of this level in clinical experiments is virtually impossible because the magnitude of CGM errors cannot be manipulated and related prospectively to clinical outcomes.
Materials and methods: A combination of archival data (parallel CGM, insulin pump, self-monitoring of blood glucose [SMBG] records, and meals for 56 pump users with type 1 diabetes) and in silico experiments was used to "replay" real-life treatment scenarios and relate sensor error to glycemic outcomes. Nominal blood glucose (BG) traces were extracted using a mathematical model, yielding 2,082 BG segments each initiated by insulin bolus and confirmed by SMBG. These segments were replayed at seven sensor accuracy levels (mean absolute relative differences [MARDs] of 3-22%) testing six scenarios: insulin dosing using sensor values, threshold, and predictive alarms, each without or with considering CGM trend arrows.
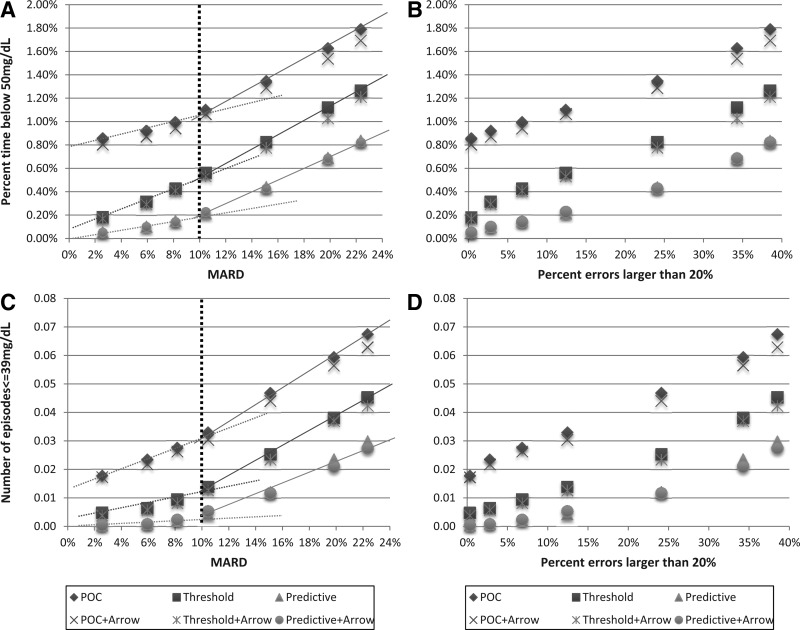
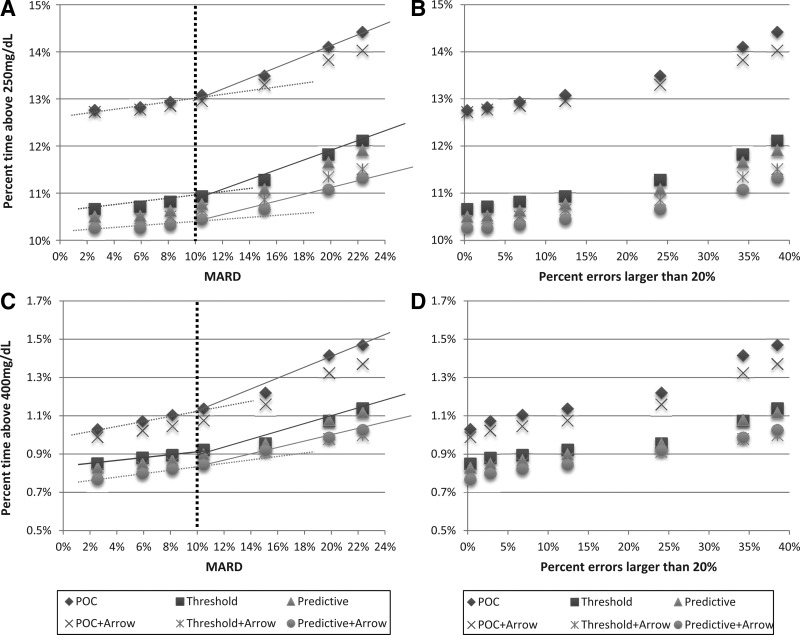
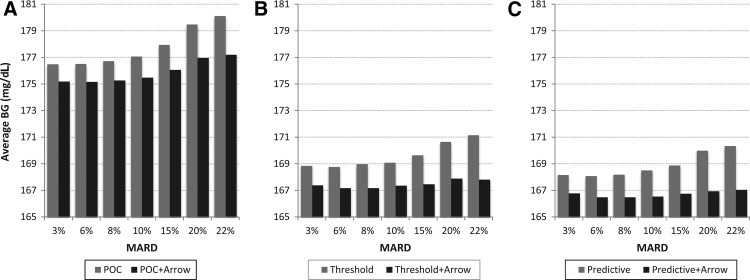
Results: In all six scenarios, the occurrence of hypoglycemia (frequency of BG levels ≤50 mg/dL and BG levels ≤39 mg/dL) increased with sensor error, displaying an abrupt slope change at MARD =10%. Similarly, hyperglycemia (frequency of BG levels ≥250 mg/dL and BG levels ≥400 mg/dL) increased and displayed an abrupt slope change at MARD=10%. When added to insulin dosing decisions, information from CGM trend arrows, threshold, and predictive alarms resulted in improvement in average glycemia by 1.86, 8.17, and 8.88 mg/dL, respectively.
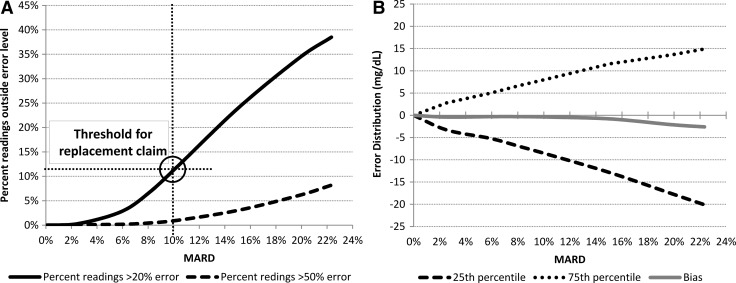
Conclusions: Using CGM for insulin dosing decisions is feasible below a certain level of sensor error, estimated in silico at MARD=10%. In our experiments, further accuracy improvement did not contribute substantively to better glycemic outcomes.
Figures
References
-
- Mastrototaro JJ: The MiniMed continuous glucose monitoring system. Diabetes Technol Ther 2000;2(Suppl 1):S-13–S-18 - PubMed
-
- Bode BW: Clinical utility of the continuous glucose monitoring system. Diabetes Technol Ther 2000;2(Suppl 1):S-35–S-42 - PubMed
-
- Feldman B, Brazg R, Schwartz S, Weinstein R: A continuous glucose sensor based on wired enzyme technology—results from a 3-day trial in patients with type 1 diabetes. Diabetes Technol Ther 2003;5:769–778 - PubMed
-
- Deiss D, Bolinder J, Riveline J, Battelino T, Bosi E, Tubiana-Rufi N, Kerr D, Phillip M: Improved glycemic control in poorly controlled patients with type 1 diabetes using real-time continuous glucose monitoring. Diabetes Care 2006;29:2730–2732 - PubMed
-
- Garg K, Zisser H, Schwartz S, Bailey T, Kaplan R, Ellis S, Jovanovic L: Improvement in glycemic excursions with a transcutaneous, real-time continuous glucose sensor. Diabetes Care 2006;29:44–50 - PubMed
Publication types
MeSH terms
Substances
Grants and funding
LinkOut - more resources
Full Text Sources
Other Literature Sources
Medical
