. 2015 Apr-Jun;29(2):101-9.
doi: 10.1097/WAD.0000000000000071.

Alzheimer Disease Biomarkers as Outcome Measures for Clinical Trials in MCI

Affiliations

Alzheimer Disease Biomarkers as Outcome Measures for Clinical Trials in MCI

Anna Caroli et al. Alzheimer Dis Assoc Disord. 2015 Apr-Jun.

Abstract

Background: The aim of this study was to compare the performance and power of the best-established diagnostic biological markers as outcome measures for clinical trials in patients with mild cognitive impairment (MCI).

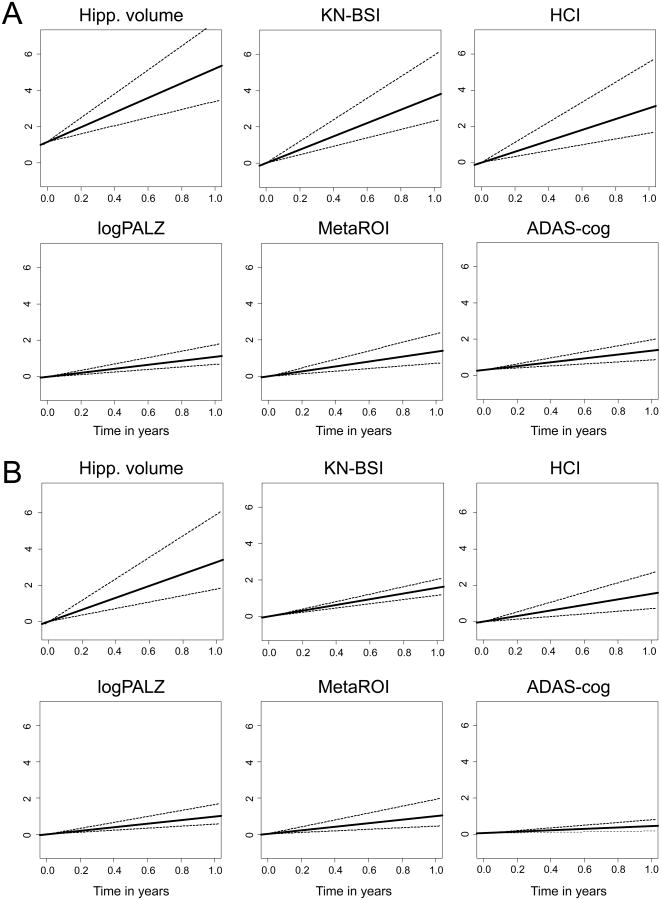
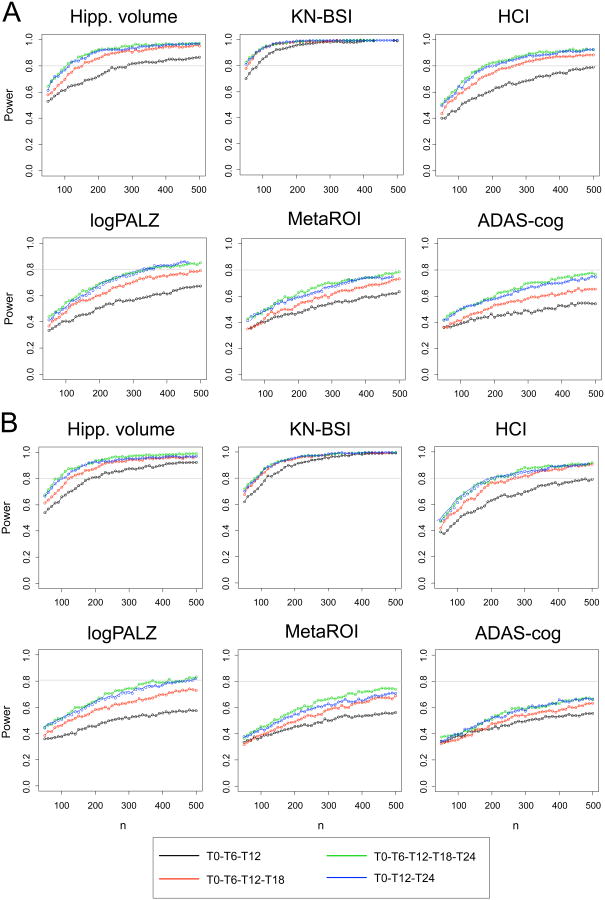
Methods: Magnetic resonance imaging, F-18 fluorodeoxyglucose positron emission tomography markers, and Alzheimer's Disease Assessment Scale-cognitive subscale were compared in terms of effect size and statistical power over different follow-up periods in 2 MCI groups, selected from Alzheimer's Disease Neuroimaging Initiative data set based on cerebrospinal fluid (abnormal cerebrospinal fluid Aβ1-42 concentration-ABETA+) or magnetic resonance imaging evidence of Alzheimer disease (positivity to hippocampal atrophy-HIPPO+). Biomarkers progression was modeled through mixed effect models. Scaled slope was chosen as measure of effect size. Biomarkers power was estimated using simulation algorithms.

Results: Seventy-four ABETA+ and 51 HIPPO+ MCI patients were included in the study. Imaging biomarkers of neurodegeneration, especially MR measurements, showed highest performance. For all biomarkers and both MCI groups, power increased with increasing follow-up time, irrespective of biomarker assessment frequency.

Conclusion: These findings provide information about biomarker enrichment and outcome measurements that could be employed to reduce MCI patient samples and treatment duration in future clinical trials.


Conflict of interest statement

Disclosure statement: No actual or potential conflicts of interest need to be disclosed.

Figures

Figure 1
Figure 1
Scaled slopes for individual biomarkers with 95% credible regions, estimated in MCI patients with abnormal CSF Aβ 1-42 concentration (ABETA+, A) or positive to hippocampal atrophy (HIPPO+, B) using all data available in the T0-T6-T12 time set, given the estimated intercept (intercept of 0 for KN-BSI). ADAS-cog=Alzheimer's Disease Assessment Scale-cognitive subscale; logPALZ=log-transformed PMOD Alzheimer score ; HCI=hypometabolic convergence index ; MetaROI=FDG-PET summary metric based on meta-analitically derived regions of interest reflecting AD hypometabolism pattern ; Hipp. volume=hippocampal volume automatically computed by Freesurfer algorithm; KN-BSI=brain atrophy rate measured by KN boundary shift integral technique . MR biomarkers showed highest effect size in both MCI groups.
Figure 2
Figure 2
Estimated power of a hypothetical clinical trial designed to detect 20% reduction in biomarker slope in MCI patients with abnormal CSF Aβ 1-42 concentration (ABETA+, A) or positive to hippocampal atrophy (HIPPO+, B), as a function of sample size (per treatment arm) and follow-up time sets. Significance level was set to α = 0.05. ADAS-cog=Alzheimer's Disease Assessment Scale-cognitive subscale; logPALZ=log-transformed PMOD Alzheimer score ; HCI=hypometabolic convergence index ; MetaROI=FDG-PET summary metric based on meta-analitically derived regions of interest reflecting AD hypometabolism pattern ; Hipp. volume=hippocampal volume automatically computed by Freesurfer algorithm; KN-BSI=brain atrophy rate measured by KN boundary shift integral technique ; T0=baseline, Tn=n-month follow-up. For all biomarkers and both MCI groups, the power increased with increasing follow-up time, irrespective of biomarker assessment frequency. MR measures showed highest power (with KN-BSI outperforming hippocampal volume), and a nonlinear trend.

References

    1. Selkoe DJ. Resolving controversies on the path to Alzheimer's therapeutics. Nat Med. 2011;17:1060–1065. - PubMed
    1. Selkoe DJ. Preventing Alzheimer's disease. Science. 2012;337:1488–1492. - PubMed
    1. Aisen PS. Clinical trial methodologies for disease-modifying therapeutic approaches. Neurobiol Aging. 2011;32(Suppl 1):S64–S66. - PMC - PubMed
    1. Sperling RA, Aisen PS, Beckett LA, et al. Toward defining the preclinical stages of Alzheimer's disease: recommendations from the National Institute on Aging-Alzheimer's Association workgroups on diagnostic guidelines for Alzheimer's disease. Alzheimers Dement. 2011;7:280–292. - PMC - PubMed
    1. Lorenzi M, Donohue M, Paternicò D, et al. Alzheimer's Disease Neuroimaging Initiative. Enrichment through biomarkers in clinical trials of Alzheimer's drugs in patients with mild cognitive impairment. Neurobiol Aging. 2010;31:1443–1451. - PubMed

Publication types

MeSH terms