

The role of additional pulses in electropermeabilization protocols
- PMID: 25437512
- PMCID: PMC4249911
- DOI: 10.1371/journal.pone.0113413
The role of additional pulses in electropermeabilization protocols
Abstract
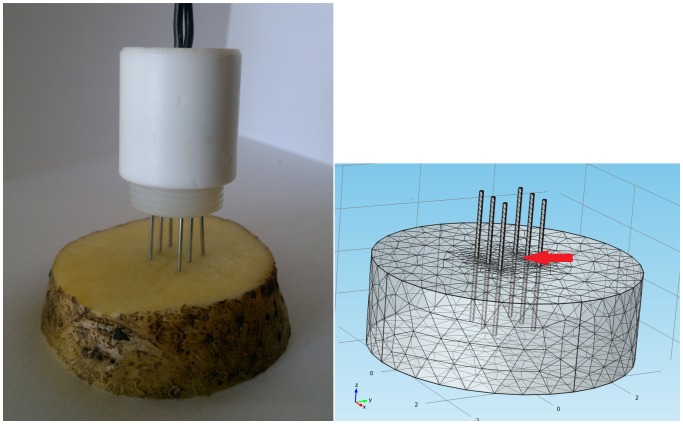
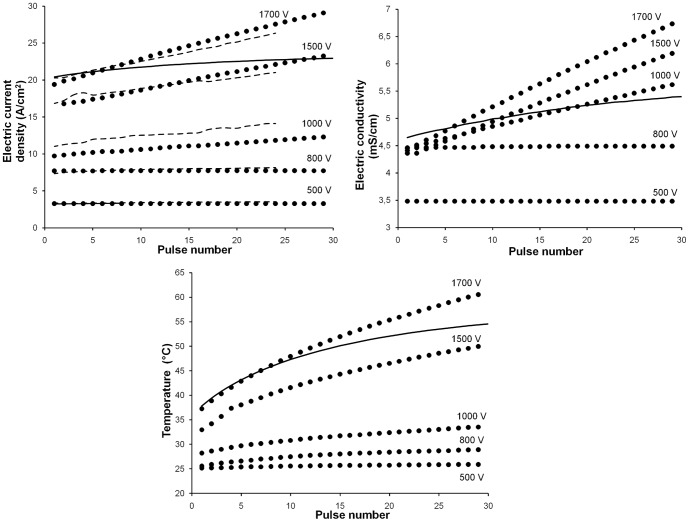
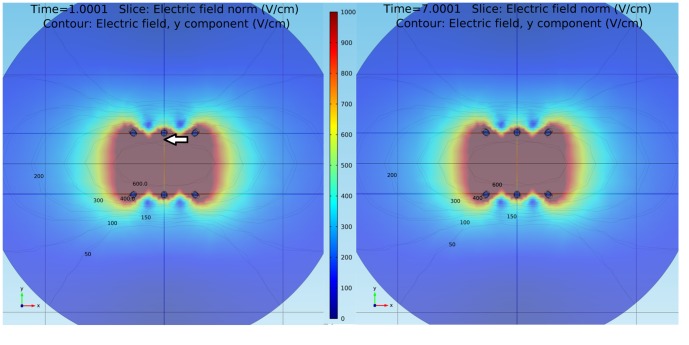
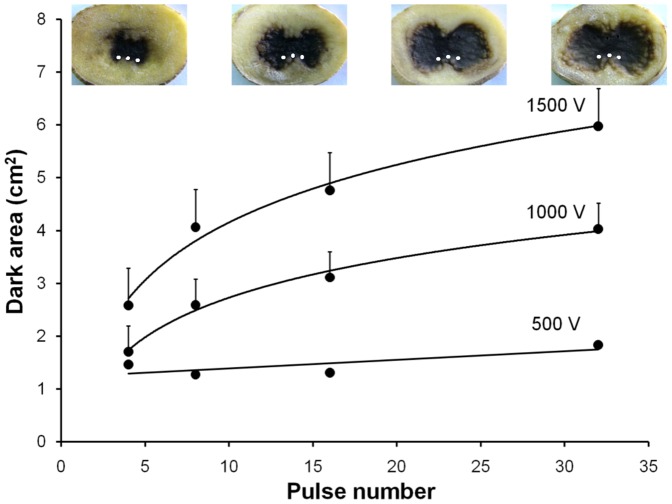
Electropermeabilization (EP) based protocols such as those applied in medicine, food processing or environmental management, are well established and widely used. The applied voltage, as well as tissue electric conductivity, are of utmost importance for assessing final electropermeabilized area and thus EP effectiveness. Experimental results from literature report that, under certain EP protocols, consecutive pulses increase tissue electric conductivity and even the permeabilization amount. Here we introduce a theoretical model that takes into account this effect in the application of an EP-based protocol, and its validation with experimental measurements. The theoretical model describes the electric field distribution by a nonlinear Laplace equation with a variable conductivity coefficient depending on the electric field, the temperature and the quantity of pulses, and the Penne's Bioheat equation for temperature variations. In the experiments, a vegetable tissue model (potato slice) is used for measuring electric currents and tissue electropermeabilized area in different EP protocols. Experimental measurements show that, during sequential pulses and keeping constant the applied voltage, the electric current density and the blackened (electropermeabilized) area increase. This behavior can only be attributed to a rise in the electric conductivity due to a higher number of pulses. Accordingly, we present a theoretical modeling of an EP protocol that predicts correctly the increment in the electric current density observed experimentally during the addition of pulses. The model also demonstrates that the electric current increase is due to a rise in the electric conductivity, in turn induced by temperature and pulse number, with no significant changes in the electric field distribution. The EP model introduced, based on a novel formulation of the electric conductivity, leads to a more realistic description of the EP phenomenon, hopefully providing more accurate predictions of treatment outcomes.
Conflict of interest statement
Figures
References
-
- Mir L (2006) Bases and rationale of the electrochemotherapy. European Journal of Cancer Supp 4 38–44.
-
- Yarmush ML, Golberg A, Sersa G, Kotnik T, Miklavcic D (2014) Electroporation-based technologies for medicine: Principles, applications, and challenges. Annual Review of Biomedical Engineering 16:295–320. - PubMed
-
- Escoffre JM, Portet T, Wasungu L, Teissié J, Dean D, et al. (2009) What is (still not) known of the mechanism by which electroporation mediates gene transfer and expression in cells and tissues. Molecular Biotechnology 41:286–295. - PubMed
Publication types
MeSH terms
LinkOut - more resources
Full Text Sources
Other Literature Sources
