. 2014 Nov 6;9(3):967-82.
doi: 10.1016/j.celrep.2014.09.051. Epub 2014 Oct 30.

Host cell factor-1 recruitment to E2F-bound and cell-cycle-control genes is mediated by THAP11 and ZNF143

Affiliations

Host cell factor-1 recruitment to E2F-bound and cell-cycle-control genes is mediated by THAP11 and ZNF143

J Brandon Parker et al. Cell Rep. .

Abstract

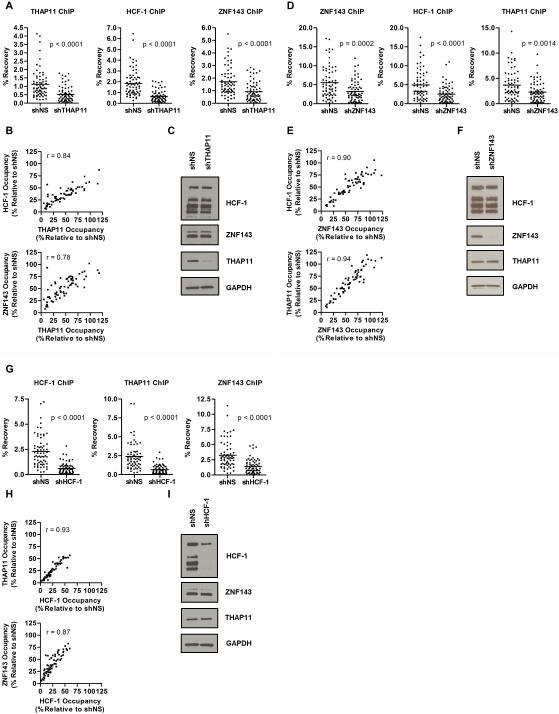
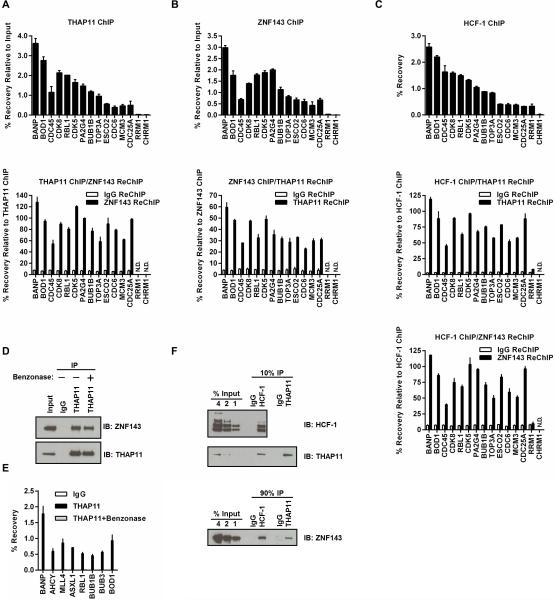
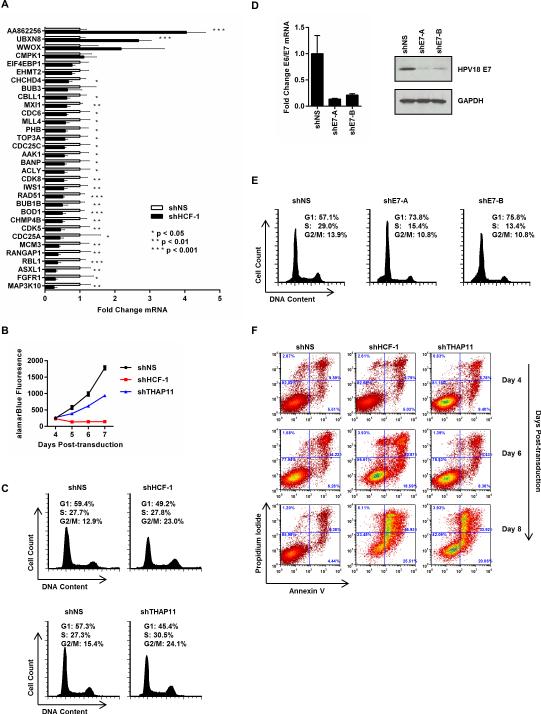
Host cell factor-1 (HCF-1) is a metazoan transcriptional coregulator essential for cell-cycle progression and cell proliferation. Current models suggest a mechanism whereby HCF-1 functions as a direct coregulator of E2F proteins, facilitating the expression of genes necessary for cell proliferation. In this report, we show that HCF-1 recruitment to numerous E2F-bound promoters is mediated by the concerted action of zinc finger transcription factors THAP11 and ZNF143, rather than E2F proteins directly. THAP11, ZNF143, and HCF-1 form a mutually dependent complex on chromatin, which is independent of E2F occupancy. Disruption of the THAP11/ZNF143/HCF-1 complex results in altered expression of cell-cycle control genes and leads to reduced cell proliferation, cell-cycle progression, and cell viability. These data establish a model in which a THAP11/ZNF143/HCF-1 complex is a critical component of the transcriptional regulatory network governing cell proliferation.


Figures

Figure 1
Figure 1. HCF-1 occupancy at E2F target genes correlates with THAP11 and ZNF143 binding
(A) HCF-1, THAP11, ZNF143, and E2F1 chromatin occupancy determined by ChIP assay in HeLa cells at the indicated 62 E2F1 target genes containing putative THAP11/ZNF143 binding motifs. (B) Matrix of pairwise Pearson product-moment correlation coefficients from ChIP assays in panel A. (C) Distribution of THAP11, HCF-1, ZNF143, and E2F1 on the promoter proximal regions of E2F1 target genes determined by ChIP-scanning assays. (D) Schematic illustrating the positions of promoter proximal ChIP amplicons (black rectangles) analyzed in panel C. The approximate locations of putative THAP11/ZNF143 and known E2F1 binding sites are indicated. First exons of the indicated genes are denoted by blue rectangles. See also Figure S1.
Figure 2
Figure 2. THAP11, HCF-1, and ZNF143 chromatin occupancy are interdependent
THAP11, HCF-1, and ZNF143 chromatin occupancy was determined at each of the 62 genes shown in Fig.1A in THAP11, HCF-1 or ZNF143 knockdown HeLa cells. (A) ChIP in HeLa cells expressing either control (shNS) or THAP11 (shTHAP11) shRNA. (B) Scatterplots of HCF-1 (top panel) or ZNF143 (bottom panel) chromatin occupancy relative to THAP11 binding. (C) Immunoblots of THAP11, HCF-1, and ZNF143 in THAP11 knockdown HeLa cells. (D) ChIP in HeLa cells expressing either control or ZNF143 shRNA. (E) Scatterplots of HCF-1 (top panel) or THAP11 (bottom panel) chromatin occupancy relative to ZNF143 binding. (F) Immunoblots of THAP11, HCF-1, and ZNF143 in ZNF143 knockdown HeLa cells. (G) ChIP in HeLa cells expressing control or HCF-1 shRNA. (H) Scatterplots of THAP11 (top panel) or ZNF143 (bottom panel) chromatin occupancy relative to HCF-1. (I) Immunoblots of THAP11, HCF-1, and ZNF143 in HCF-1 knockdown HeLa cells. In panels A, B, D, E, G, and H each point represents one of 62 genes shown in Fig.1A. Values are expressed as percent recovery relative to input. In panels B, E, and H values are expressed as percent occupancy relative to control shRNA (shNS) expressing cells. Student's T-test p-values and Pearson product-moment correlation coefficient (r) values are indicated.
Figure 3
Figure 3. THAP11, HCF-1, and ZNF143 simultaneously co-occupy chromatin
(A) THAP11 ChIP (top panel) followed by ZNF143 or control IgG ReChIP (bottom panel). (B) ZNF143 ChIP (top panel) followed by THAP11 or control IgG ReChIP. (C) HCF-1 ChIP (top panel) followed by THAP11 ReChIP (middle panel) or ZNF143 ReChIP (bottom panel). (D) ZNF143 co-precipitation with THAP11 in formaldehyde-crosslinked SW620 cells is Benzonase-resistant. THAP11 ChIP-enriched material was treated with or without Benzonase. Digested nucleic acids and any associated proteins were removed by extensive washing, and remaining ZNF143 was detected by immunoblot. Input corresponds to 5% of starting material. (E) Confirmation of Benzonase digestion to remove THAP11 associated DNA was determined by qPCR using primers corresponding to THAP11 binding sites at indicated gene promoters. (F) ZNF143 associates with both THAP11 and HCF-1 in soluble nuclear extracts. HCF-1 and THAP11 were immunoprecipitated from SW620 nuclear extracts and co-precipitated ZNF143 was detected by immunoblot. In the top and middle panels, 10% of the immunoprecipitation was loaded for immunoblot. In the bottom panel, 90% of the immunoprecipitation was analyzed. In panels A-C and E values represent mean ± standard deviation of duplicate qPCR reactions from a single experiment performed at least three times with similar results. ChIP values are expressed as percent recovery relative to input. ReChIP values are expressed as percent recovery relative to the initial ChIP. qPCR amplicons below the limit of reliable detection are indicated as N.D. (not detected).
Figure 4
Figure 4. E2F binding is dispensable for HCF-1 recruitment to chromatin
(A) E2F1 and HCF-1 ChIP in HeLa cells expressing either control (shNS) or E2F1 (shE2F1) shRNA. Each point represents one of 62 genes shown in Fig.1A. Student's T-test p-values are indicated. (B) Immunoblots from control and E2F1 knockdown cells shown in panel A. (C) HCF-1, DP1, E2F1, and E2F3 ChIP assays in HeLa cells expressing either control or DP1 shRNA. (D) Immunoblots from control and DP1 knockdown cells shown in panel C. (E) Schematic of the RBL1 promoter construct stably integrated in T98G cells. Numbers indicate position relative to the annotated RBL1 transcription start site. The putative THAP11/ZNF143 binding site and known E2F binding sites are indicated by an oval and circles, respectively. The relative position of the qPCR primers used to detect occupancy at the promoter or luciferase coding sequence are indicated by closed and open arrowheads, respectively. (F) HCF-1 and DP1 binding in T98G cells at the chromosomally integrated RBL1 wildtype (WT) and E2F binding site mutant promoters as determined by ChIP. (G) THAP11, HCF-1, and DP1 occupancy at the indicated E2F binding site in T98G cells as determined by ChIP assays. (H) E2F1 and HCF-1 ChIP in HeLa cells expressing either control (shNS) or E2F1 shRNAs. Binding was determined at E2F-bound promoters shown to be either THAP11/ZNF143-bound (positive) or unbound (negative). In panels C, F, G and H values represent mean ± standard deviation of duplicate qPCR reactions from a single experiment performed at least three times with similar results. See also Figure S2.
Figure 5
Figure 5. THAP11 and ZNF143, but not E2F1, genome-wide chromatin occupancy correlates with HCF-1 binding
(A) For E2F1, THAP11, or ZNF143 ChIP-seq peaks within 500 bases of HCF-1 peaks, the absolute distances between peak centers are plotted as box-and-whisker plots. Whiskers indicate bottom 10% and top 90% of the population. (B, C, D) At co-localized regions, ChIP-seq tags for each protein were counted in the 1000bp region surrounding the HCF-1 binding sites. The total number of peak pairs (n) and Pearson product-moment correlation coefficient (r) are indicated. See also Figure S3.
Figure 6
Figure 6. HCF-1 cell cycle-dependent promoter recruitment correlates with THAP11 and ZNF143 occupancy
(A) Immunoblots from thymidine-nocodazole synchronized HeLa cells upon nocodazole release. (B) ChIP assays from synchronized HeLa cells in panel A. ChIP signal is expressed as a percent of the maximum signal observed throughout the time course. Values represent mean ± standard deviation of duplicate PCR reactions from a single experiment performed at least three times with similar results.
Figure 7
Figure 7. THAP11/ZNF143/HCF-1-dependent gene expression contributes to cell proliferation and cell cycle progression
(A) Quantitative RT-PCR-determined mRNA expression changes at THAP11/HCF-1/ZNF143 co-occupied E2F-bound genes in HeLa cells expressing either control or HCF-1 shRNA. Values represent the mean ± standard deviation of four independent experiments. Student's T-test p-values are indicated. (B) HeLa cells expressing the indicated shRNA were plated in 96-well plates (5000 cells/well) four days post-transduction and viable cells detected using alamarBlue every 24 hours for 4 days. Values represent the mean ± standard deviation from two independent experiments. (C) Cell cycle analysis of HeLa cells collected four days post-transduction with HCF-1, THAP11 or control (shNS) shRNA. (D, left panel) Quantitative RT-PCR determined HPV18 E6/E7 transcript levels in HeLa cells collected four days post-transduction with control or two independent HPV18 E7 shRNAs. Values represent the mean ± standard deviation of two independent experiments. (D, right panel) E7 immunoblot in HeLa cells expressing the indicated shRNA. (E) Cell cycle analysis of E6/E7 knockdown HeLa cells in panel D. (F) HeLa cells expressing the indicated shRNA were collected at 4, 6, and, 8 days post-transduction and analyzed for Annexin V and propidium iodide staining by flow cytometry. See also Figure S4.

References

    1. Ajuh PM, Browne GJ, Hawkes NA, Cohen PT, Roberts SG, Lamond AI. Association of a protein phosphatase 1 activity with the human factor C1 (HCF) complex. Nucleic Acids Res. 2000;28:678–686. - PMC - PubMed
    1. Bailey TL, Boden M, Buske FA, Frith M, Grant CE, Clementi L, Ren J, Li WW, Noble WS. MEME SUITE: tools for motif discovery and searching. Nucleic Acids Res. 2009;37:W202–208. - PMC - PubMed
    1. Bailey TL, Gribskov M. Combining evidence using p-values: application to sequence homology searches. Bioinformatics. 1998;14:48–54. - PubMed
    1. Brehm A, Miska EA, McCance DJ, Reid JL, Bannister AJ, Kouzarides T. Retinoblastoma protein recruits histone deacetylase to repress transcription. Nature. 1998;391:597–601. - PubMed
    1. Burkhart DL, Wirt SE, Zmoos AF, Kareta MS, Sage J. Tandem E2F binding sites in the promoter of the p107 cell cycle regulator control p107 expression and its cellular functions. PLoS Genet. 2010;6:e1001003. - PMC - PubMed

Publication types