. 2014 Nov 6;9(3):1007-22.
doi: 10.1016/j.celrep.2014.09.049. Epub 2014 Oct 23.

Independent stem cell lineages regulate adipose organogenesis and adipose homeostasis

Affiliations

Independent stem cell lineages regulate adipose organogenesis and adipose homeostasis

Yuwei Jiang et al. Cell Rep. .

Abstract

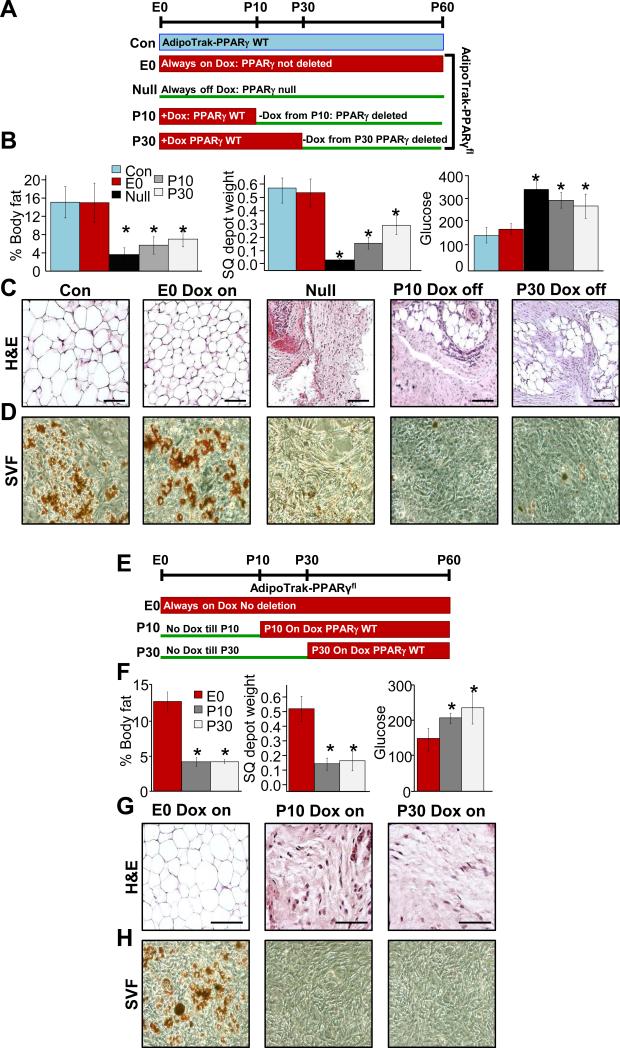
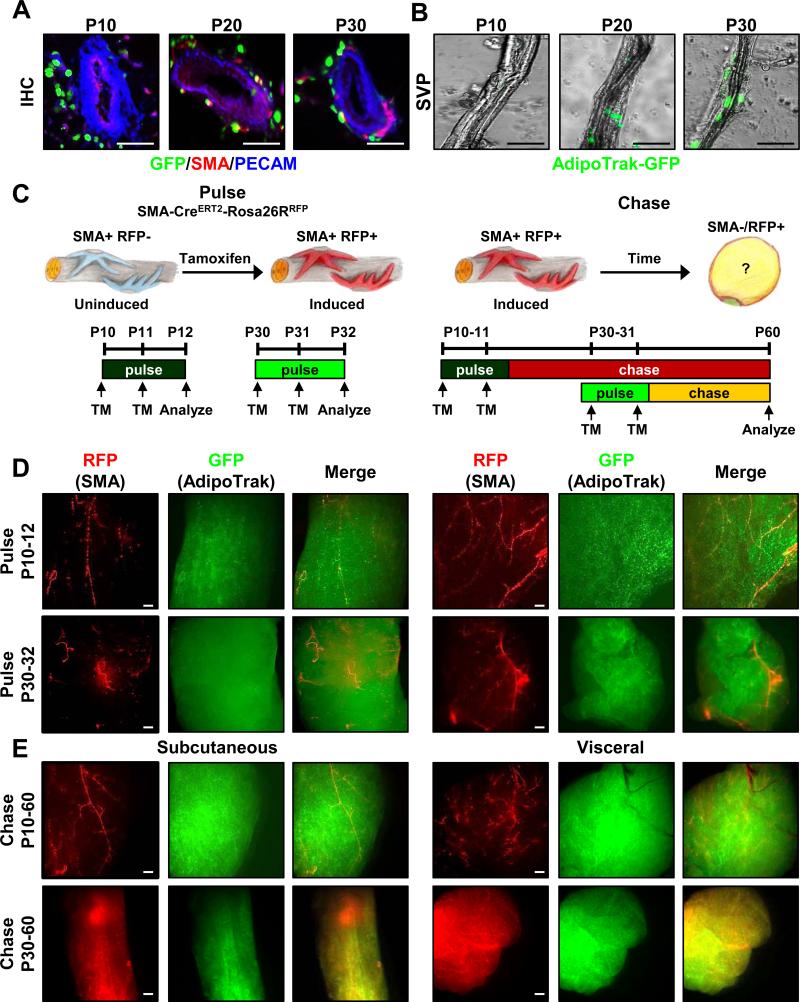
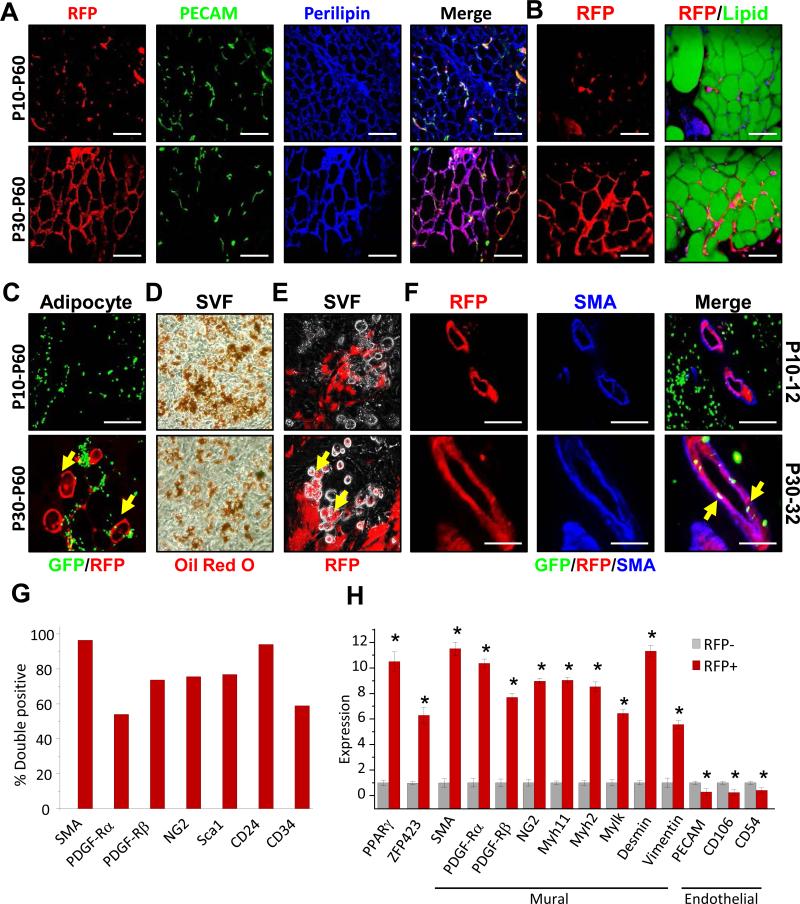
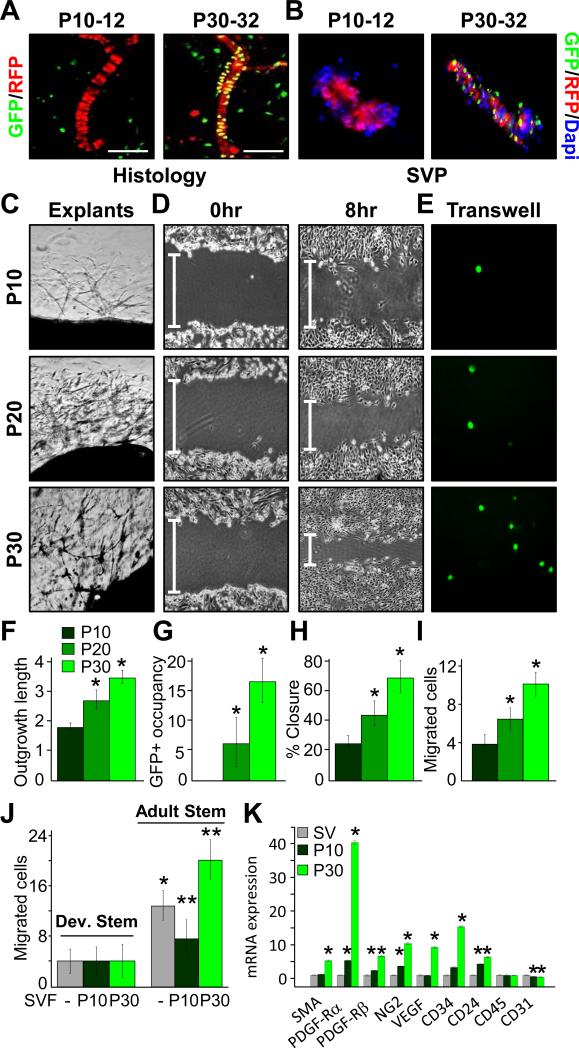
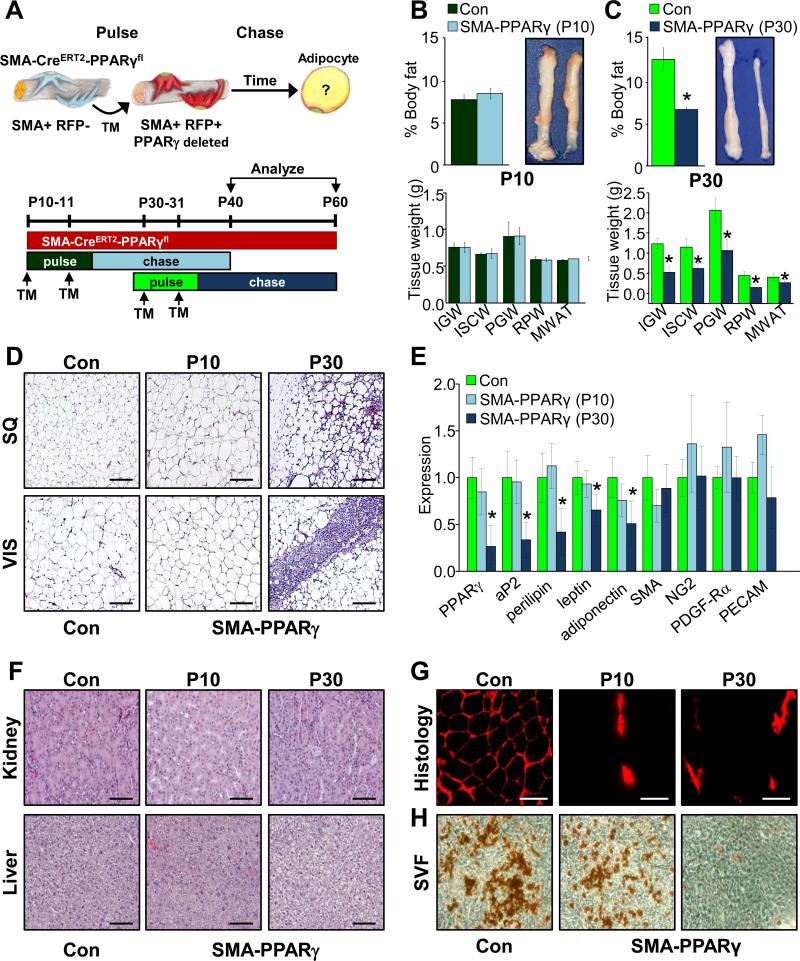
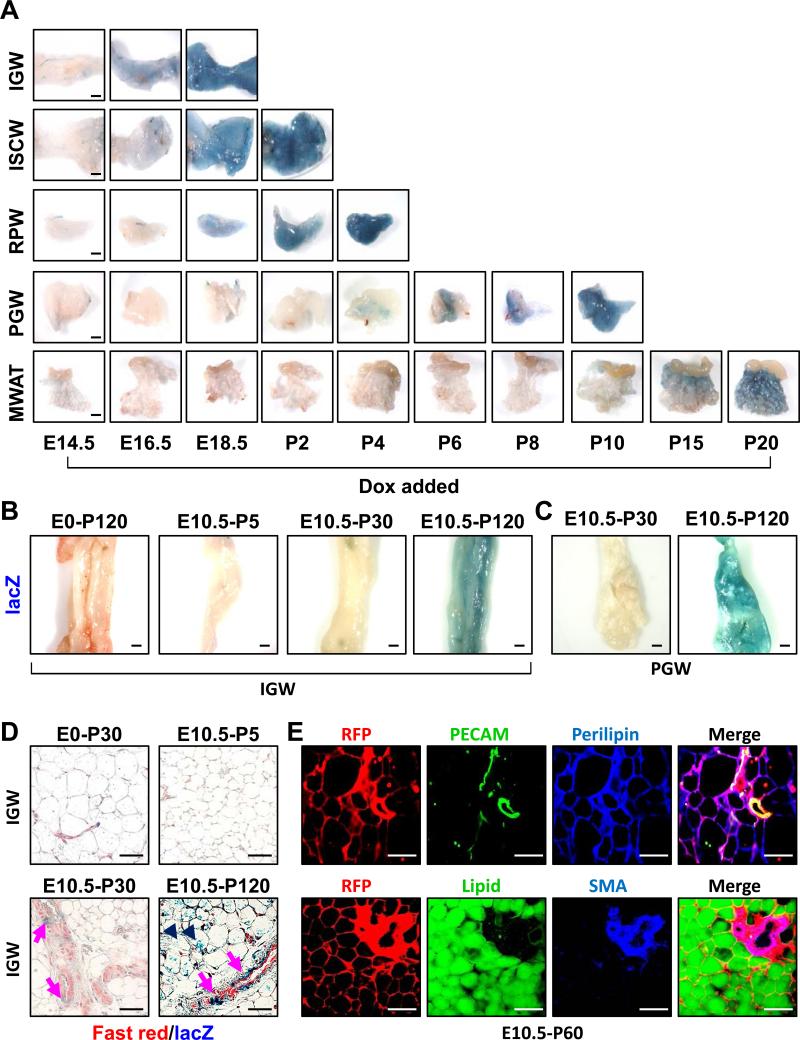
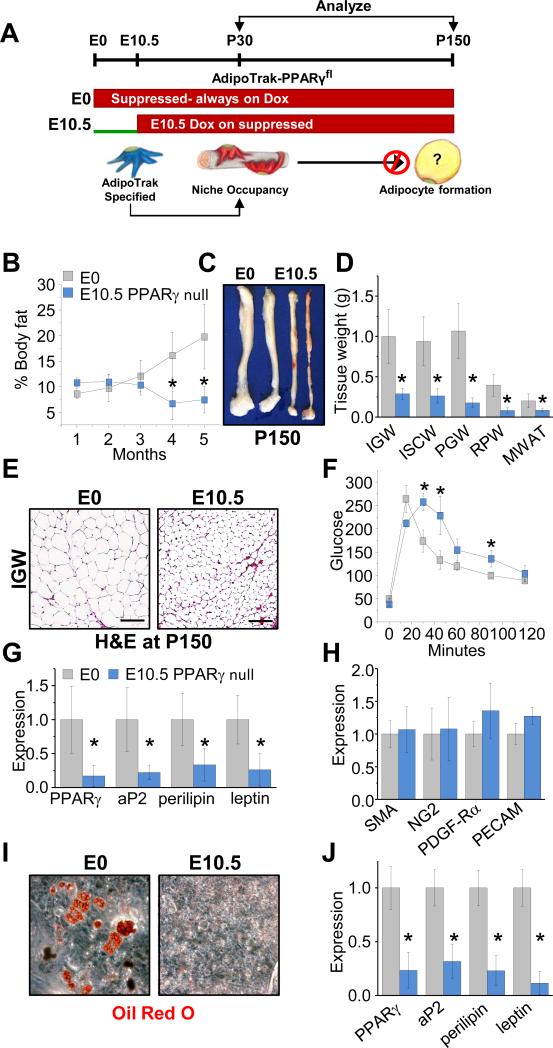
Adipose tissues have striking plasticity, highlighted by childhood and adult obesity. Using adipose lineage analyses, smooth muscle actin (SMA)-mural cell-fate mapping, and conditional PPARγ deletion to block adipocyte differentiation, we find two phases of adipocyte generation that emanate from two independent adipose progenitor compartments: developmental and adult. These two compartments are sequentially required for organ formation and maintenance. Although both developmental and adult progenitors are specified during the developmental period and express PPARγ, they have distinct microanatomical, functional, morphogenetic, and molecular profiles. Furthermore, the two compartments derive from different lineages; whereas adult adipose progenitors fate-map from an SMA+ mural lineage, developmental progenitors do not. Remarkably, the adult progenitor compartment appears to be specified earlier than the developmental cells and then enters the already developmentally formed adipose depots. Thus, two distinct cell compartments control adipose organ development and organ homeostasis, which may provide a discrete therapeutic target for childhood and adult obesity.


Figures

Figure 1
Figure 1. AdipoTrak labeled adipose progenitors are required for adipose tissue development and homeostasis
A) Experimental design: AdipoTrak-PPARγfl/tTA mice were either maintained constitutively on Dox throughout life (suppressed, E0) or not on Dox throughout life (Null), or Dox was removed at the 10th or 30th day of life to induce deletion of PPARγ occurred in AdipoTrak labeled cells.AdipoTrak (PPARγtTA/+; TRE-Cre) mice were used as control. B) Body fat content, subcutaneous (SQ) depot weights and random glucose levels of AdipoTrak (Con, no Dox), constitutively suppressed mutant (E0, Dox ON), constitutive deletion (PPARγ Null), P10 and P30 Dox off (PPARγ mutants); *P<0.05 versus control levels. C) H&E staining of adipose depots of mice described in (A). D) Oil Red O staining of adipogencially induced SV cells isolated from the above mice at P60. Scale = 100 μm. E-G) Experimental design: AdipoTrak-PPARγfl/tTA mice were administered Dox before conception or Dox was added at P10 or P30 (E) and at P60 mice were analyzed fat content, adipose depot weights and glucose levels; *P<0.05 versus control levels (F). G) H&E stained depots from mice described in (E). H) Oil Red O staining of adipogencially induced SV cells isolated from mice in (E) at P60. Scale = 200 μm.
Figure 2
Figure 2. Adult adipocytes derive from a mural cell source
A) Sections from P10, P20 and P30 AdipoTrak-GFP SQ depots were examined for GFP (green), PECAM (blue) and SMA (red). Scale = 100 μm. B) GFP fluorescent images of SVPs isolated from P10, P20 and P30 AdipoTrak SQ depots. C) Cartoons and schema depicting fate-mapping analysis: SMA-Cre ERT2; R26RRFP are induced with TM for two consecutive days at either P10 or P30 and then analyzed at P12 or P32 or chased to P60. D-E) AdipoTrak-GFP (PPARγtTA; TRE-H2B-GFP); SMA-Cre ERT2; R26RRFP mice were administered TM at P10 or P30 for two consecutive days and SQ (inguinal) and Vis (perigonadal) adipose depots were examined for GFP (adipose lineage) and RFP (mural lineage) fluorescence either at pulse (P10-12 or P30-32) (D) or chase (P10-60 or P30-60) (E) (See Figure S2A for experimental genotypes) Scale = 100 μm.
Figure 3
Figure 3. Developmental and Adult adipose progenitors have distinct lineages and localities
A-C) AdipoTrak-GFP; SMA-RFP mice were administered TM at P10 or P30 and chased to P60: (A) sectioned SQ depots were analyzed for RFP and immunostained for PECAM (green) and Perilipin (blue), or (B) RFP and LipidTox (lipid) staining. C) Floated adipocytes were examined for RFP (mural lineage) and GFP (adipose lineage). Yellow arrows indicate co-localization between AdipoTrak-GFP and SMA-RFP labeled adipocytes. D-E) One day after a P10 or P30 TM pulse, AdipoTrak-GFP; SMA-RFP SV cells were isolated, cultured in adipogenic conditions, and Oil Red O (adipocyte) stained (D) or examined for RFP fluorescence (E). Yellow arrows (E) indicate SMA-RFP labeled adipocytes. F) Two days after a P10 or P30 TM pulse, AdipoTrak-GFP; SMA-RFP depots were examined for RFP and GFP expression and immunostained for SMA. Yellow arrows indicate AdipoTrak-GFP; SMA-RFP labeled progenitors in a perivascular position at P30. G-H) FACS analyses (G) and mRNA analyses (H) of denoted genes in FACS isolated RFP+ or RFP− cells from SMA-RFP mice two days post TM injection. *P<0.01 RFP+ versus RFP-− cells; Scale = 100 μm.
Figure 4
Figure 4. Functional and molecular characteristics of Developmental and Adult adipose progenitors
A-B) RFP and GFP images of sectioned SQ depots from TM pulsed (P10-12, P30-32) AdipoTrak-GFP; SMA-RFP mice. Scale = 200 μm. B) SVPs were isolated from the above mice (A) and examined for RFP and GFP expression and counter stained with Dapi (nuclear, blue). C, F-G) P10, P20 and P30 AdipoTrak SQ depots were encased in Matrigel, and seven days later capillary outgrowth was assessed with pseudo-Nomarski microscopy (C), length quantification (F) and GFP+ stem cell occupancy (G). D, H) P10, P20 or P30 AdipoTrak FACS-isolated GFP SV cells were cultured to confluence, scratched, and migration was visualized (D) and quantified (H). E, I) P10, P20 or P30 AdipoTrak FACS-isolated GFP+ SV cells were placed in a modified Boyden chamber. 12 hours later transwell migration was imaged (C) and quantified (G). J) P10 and P30 FACS-isolated GFP+ cells were placed in one chamber and no cells (-), P10 or P30 SV cells in the other. GFP cell transwell migration was quantified 12 hours later. **P<0.05 versus P30 stem cell migration without SV cells. K) qPCR expression analyses of P10 or P30 FACS-isolated GFP+ SV cells, For F-K, *P<0.05 versus P10 stem cells.
Figure 5
Figure 5. Mural cells contribute to adult adipose tissue homeostasis
A-H) Experimental design: Top; cartoon depicting the experimental test; where PPARγ is temporally deleted in SMA+ cells during Developmental or Adult adipose stages. Below: experimental protocol used to test if SMA mural cells are required for adipose tissue homeostasis. SMA-PPARγ mice (SMA-CreERT2, PPARγfl/fl) were administered TM at P10 or at P30. Four weeks later (P40 or P60) they were analyzed: fat content and depot size (B, C), depot weights (B, C), H&E staining of SQ and Vis adipose tissues (D), whole depot marker expression (E), H&E staining of kidney and liver (F), and RFP fate mapping (G). *P<0.05 versus controls. H) SV cells were isolated two days after TM injection, cultured in adipogenic media and adipogenic potential was assessed by Oil Red O staining.
Figure 6
Figure 6. Temporal course of AdipoTrak labeling of adipose progenitors
A) AdipoTrak, R26RlacZ mice were Dox suppressed at the denoted times and each adipose depot was analyzed at P30 for β-galactosidase activity. B-C) AdipoTrak, R26RlacZ mice were Dox suppressed at the indicated times (E0 = pre-conception, or E10.5) and SQ depots (B) examined at P5, P30 or P120 or perigonal adipose depot (C) examined at P30 or P120 for β-galactosidase activity. D) AdipoTrak, R26RlacZ mice were Dox suppressed from E0 to P30 (control) or from E10.5 to P5, P30, and P120 and adipose depots were stained with X-gal, sectioned and stained with Nuclear Fast Red. Arrows indicate AdipoTrak cells that were marked by E10.5 and present in adult adipose depot vessels; arrowheads indicate X-gal labeled adipocytes that derived from cells marked by E10.5. E) Immunfluorescence images of adipose depot sections of AdipoTrak R26RRFP mice that were Dox suppressed from E10.5-P60 and visualized for RFP (AdipoTrak lineage) and co-stained with either PECAM or LipidTox (green) and Perilipin or SMA (blue). Scale = 200 μm.
Figure 7
Figure 7. Adult adipose progenitors are essential for adipose depot homeostasis and maintenance
A) Experimental design: AdipoTrak PPARγfl/tTA mice were Dox suppressed prior to conception (E0=control) or E10.5 and analyzed at P30 or P150 (5 months). Below: cartoon prediction, illustrating that adult adipose are specified and PPARγ deleted by E10.5 and fail to maintain adult adipose depots. B-E) AdipoTrak-PPARγfl/tTA mice were Dox suppressed before conception (E0=control) or from E10.5. Mice were maintained on Dox and analyzed at P150 (5 months of age) for: body fat content (B), SQ depot size (C), tissue weights (D), and histology (E). F) Control and E10.5 Dox suppressed AdipoTrak-PPARγfl/tTA mice at 5 months (P150) of age were analyzed for glucose sensitivity by a glucose tolerance test. G-H) mRNA expression of mature adipocyte markers (G) or mural and endothelial cell markers (H) from SQ depots of control and E10.5 Dox suppressed AdipoTrak-PPARγfl/tTA mice. I-J) SV cells were isolated from 5 month old control or E10.5 PPARγ deleted mice and cultured in adipogenic media and monitored for differentiation by Oil Red O staining (I) and mRNA expression of mature adipocyte markers (J). *P<0.05 E10.5 PPARγ versus control (n=4/group); Scale = 100 μm.

References

    1. Ahmadian M, Suh JM, Hah N, Liddle C, Atkins AR, Downes M, Evans RM. PPARgamma signaling and metabolism: the good, the bad and the future. Nat Med. 2013;19:557–566. - PMC - PubMed
    1. Ailhaud G, Grimaldi P, Negrel R. Cellular and molecular aspects of adipose tissue development. Annu Rev Nutr. 1992;12:207–233. - PubMed
    1. Armulik A, Genove G, Betsholtz C. Pericytes: developmental, physiological, and pathological perspectives, problems, and promises. Dev Cell. 2011;21:193–215. - PubMed
    1. Berry DC, Stenesen D, Zeve D, Graff JM. The developmental origins of adipose tissue. Development. 2013;140:3939–3949. - PMC - PubMed
    1. Berry R, Rodeheffer MS. Characterization of the adipocyte cellular lineage in vivo. Nat Cell Biol. 2013;15:302–308. - PMC - PubMed

Publication types