. 2014 Nov 6;9(3):1135-50.
doi: 10.1016/j.celrep.2014.09.042. Epub 2014 Oct 23.

A chaperome subnetwork safeguards proteostasis in aging and neurodegenerative disease

Affiliations

A chaperome subnetwork safeguards proteostasis in aging and neurodegenerative disease

Marc Brehme et al. Cell Rep. .

Abstract

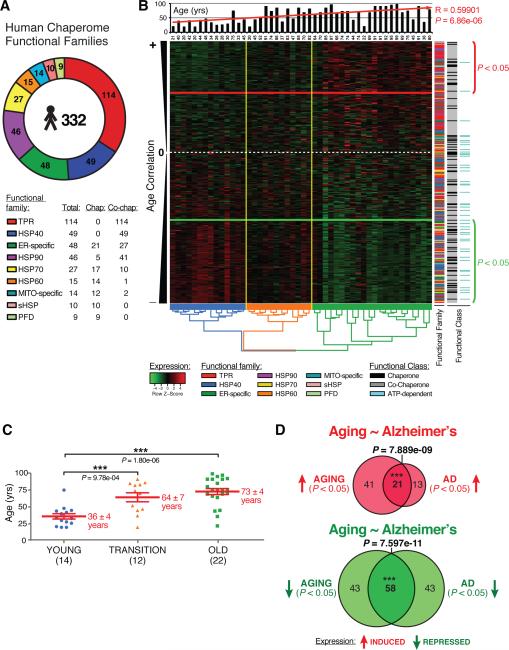
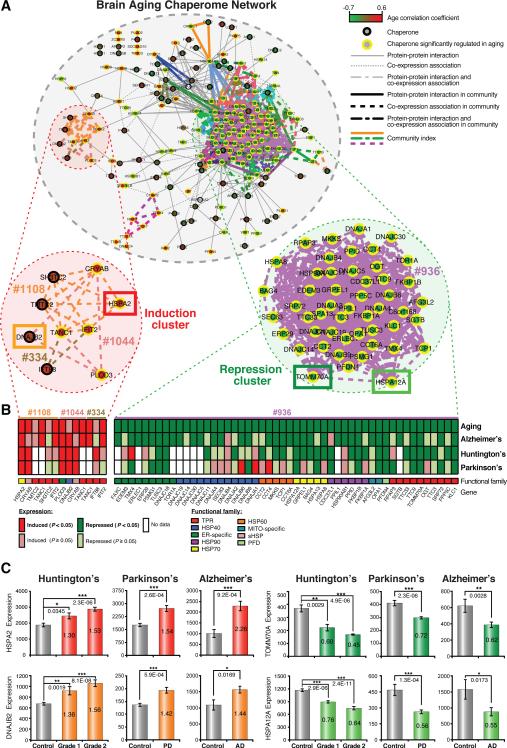
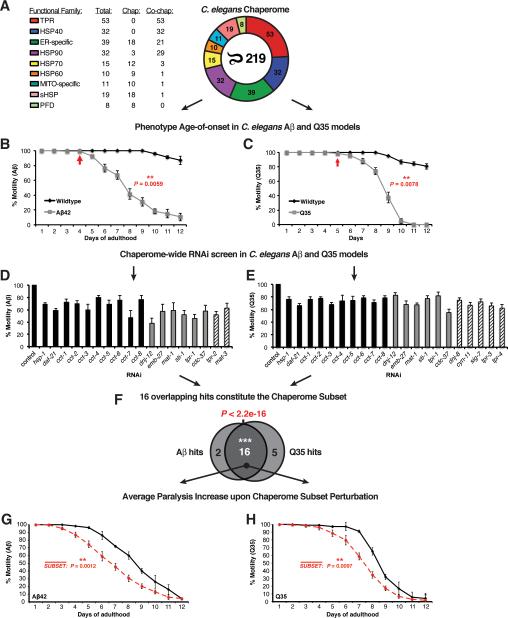
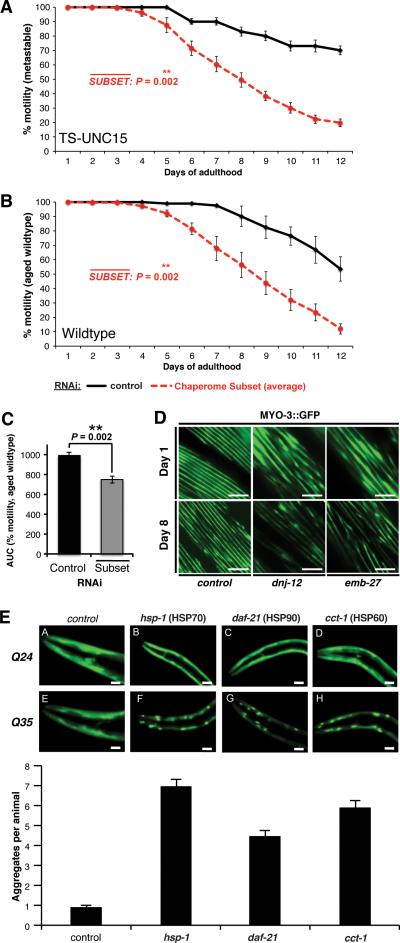
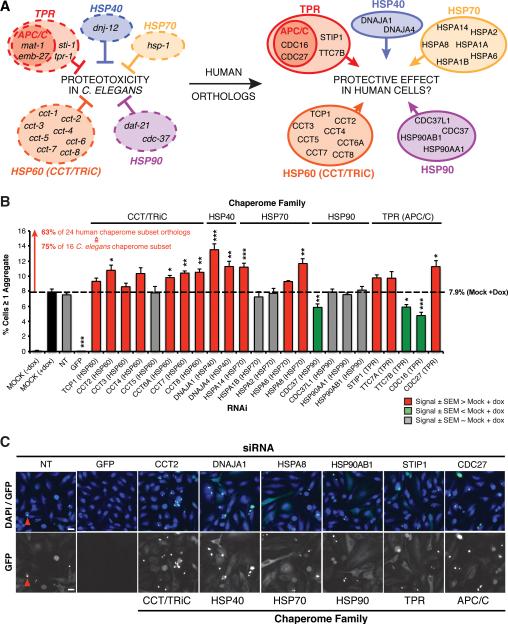
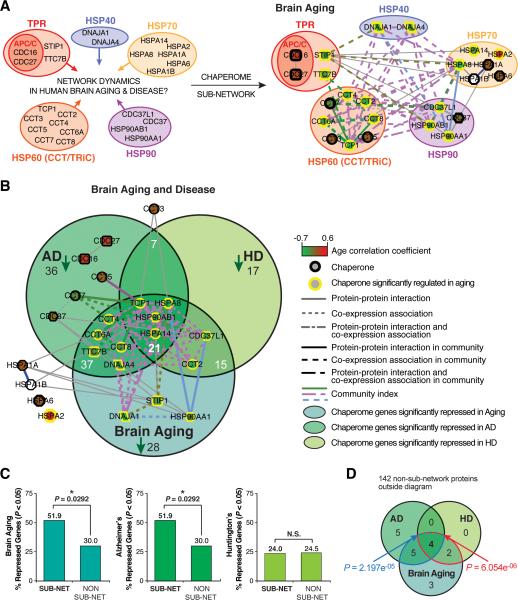
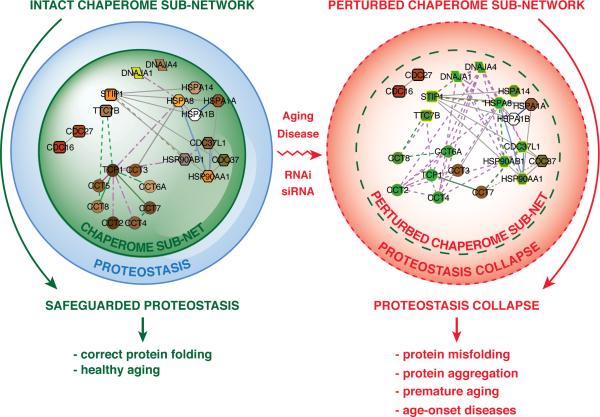
Chaperones are central to the proteostasis network (PN) and safeguard the proteome from misfolding, aggregation, and proteotoxicity. We categorized the human chaperome of 332 genes into network communities using function, localization, interactome, and expression data sets. During human brain aging, expression of 32% of the chaperome, corresponding to ATP-dependent chaperone machines, is repressed, whereas 19.5%, corresponding to ATP-independent chaperones and co-chaperones, are induced. These repression and induction clusters are enhanced in the brains of those with Alzheimer's, Huntington's, or Parkinson's disease. Functional properties of the chaperome were assessed by perturbation in C. elegans and human cell models expressing Aβ, polyglutamine, and Huntingtin. Of 219 C. elegans orthologs, knockdown of 16 enhanced both Aβ and polyQ-associated toxicity. These correspond to 28 human orthologs, of which 52% and 41% are repressed, respectively, in brain aging and disease and 37.5% affected Huntingtin aggregation in human cells. These results identify a critical chaperome subnetwork that functions in aging and disease.


Figures

Figure 1
Figure 1. Differential Chaperome Responses in Human Brain Aging and Neurodegenerative Disease
A The Human chaperome. Functional families and number of members are indicated. B. Heat map showing 318 chaperones expressed in human brain (Super Frontal Gyrus) ordered by decreasing age-correlation. The white dashed-line indicates age-expression correlation coefficient closest to zero. Genes above the red line are induced (P < 0.05), genes below the green line are repressed (P < 0.05). The histogram visualizes specimen age upon hierarchical clustering. The dendrogram visualizes hierarchical clustering of brain specimens. The y-axis color code highlights from left to right the nine chaperome families, chaperones (black), co-chaperone (grey) and ATP-dependent chaperones (turquoise). C. Three major age groups (“young” - blue, “transition” - orange, “old” - green) are visualized by dendrogram coloring in B. Values are mean age +/− SEM. *** P < 0.001, Student's t-test. D. Overlaps of chaperones induced (red) or repressed (green) in aging vs. AD. (See Figure S1, S2, S3).
Figure 2
Figure 2. Chaperome Network Community Dynamics in Brain Aging and Age-Onset Neurodegenerative Diseases
A. Integrated human chaperome network based on physical protein-protein interaction (PPI) and co-expression (COX) edges and link communities of chaperones concordantly induced or repressed during brain aging. PPIs (solid edges). COX > 0.8 (dashed edges). Color-scale indicates positive to negative correlation between age and gene expression. Link communities highlighted by edge color, yellow node borders indicate significant age expression correlation (P < 0.05). B. Chaperones and co-chaperones selected from induction and repression communities and their expression in brains from AD, HD and PD patients. (*P < 0.05, ** P < 0.01, *** P < 0.001, Student's t test). C. Heat maps visualize induction or repression in aging, AD, HD and PD at node resolution for communities highlighted in A. Community numbers and gene names are indicated. Color code micrographic visualizes functional family. Significantly induced and repressed genes (P < 0.05) shown in dark red and green, respectively and non-significantly induced and repressed genes with P ≥ 0.05 are shown in light red and light green. (See Figure S2, S3).
Figure 3
Figure 3. Functional Chaperome Perturbation Analyses in C.elegans Models of Protein Misfolding
A. The C. elegans Chaperome with its functional families and numbers of members per family are shown. B. Paralysis (% motility) for wild type and Aβ42 expressing C. elegans from day 1 to day 12 of adulthood. Arrow indicates paralysis age-of-onset. C. Motility defects for wild type and Q35-expressing C. elegans from day 1 to day 12. Arrow indicates age-of-onset. D. RNAi paralysis phenotypes on day 4 of adulthood (% motility) for C. elegans expressing Aβ42 (Mean ± SEM, n=3 and n ≥ 25 animals/trial). E. RNAi motility defects on day 2 of adulthood (% motility) for C. elegans expressing Q35 (Mean ± SEM, n=3 and n ≥ 25 animals/trial). F. Venn diagram indicating significant overlap of 16 hits from both screens (P < 2.2e-16, Fisher's exact test). G. Average paralysis (% motility) for RNAi of all 16 chaperome subset genes in Aβ42 expressing C. elegans throughout adulthood (days 1 to 12). Data points are means of corresponding data points in each RNAi experiment, each based on n ≥ 3 independent experiments and n ≥ 25 animals/trial. ** P < 0.01, Student's t-test. H. Average paralysis (% motility) for chaperome subset RNAi in Q35 expressing C. elegans throughout adulthood (days 1 to 12). Data points as in G. (See Figure S4).
Figure 4
Figure 4. A Chaperome Subset Safeguards C. elegans Proteostasis against Aging-Related Proteotoxicity
A. Average paralysis (% motility) for chaperome subset RNAi in the unc-15(e1402) TS-strain at 15°C throughout adulthood (days 1 to 12). Data points are means of corresponding data points in each RNAi experiment, based on n ≥ 3 experiments and n ≥ 20 animals/trial. ** P < 0.01, Student's t-test. B. Average paralysis (% motility) in aged wild type animals throughout adulthood (days 1 to 12). Data points as in A. C. Early-onset paralysis (% motility) upon chaperome subset RNAi in aged wild type animals (compare B.) as area under the curve (AUC) for control aging wild type worms (n=5) and average of RNAi-treated aging wild type worms (n=3). ** P < 0.01, Student's t-test. D. Sarcopenia phenotype upon control, dnj-12 and emb-27 RNAi visualized by MYO3::GFP fluorescence at day 1 vs. day 8 of adulthood. Scale bar, 10μm E. Early-onset aggregation of polyQ (Q35) expressed in body wall muscle cells upon chaperome subset RNAi. Q25, sub-threshold polyQ. Graph shows increased aggregate count upon RNAi compared to control (Mean ± SEM, n ≥ 100 animals, n = 3, scale bar: 0.02mm). (See Figure S4).
Figure 5
Figure 5. Human Chaperome Sub-Network Safeguards Proteostasis against Huntingtin aggregation
A. 16 chaperome subset members identified by RNAi screens in Aβ42 and Q35 C. elegans models grouped by functional family. APC/C, anaphase-promoting complex/cyclosome and the corresponding 24 human chaperome subset members identified by orthology mapping. B. Percentage of HeLa cells with ≥ one Huntingtin-exon1(Q78)-GFP (HTT-GFP) aggregate and upon siRNA. Results shown for all 24 human orthologs expressed in HeLa, corresponding to the 16 C. elegans chaperome subset members (mean ± SEM, n=6). Red, grey and green bars represent increased, unchanged and decreased aggregation, respectively measured as “%Cells ≥ 1 aggregate”. * P < 0.05, ** P < 0.01, *** P < 0.001, Student's t-test. C. Representative images for non-targeting (NT) siRNA, siRNA-GFP (positive control) and siRNA against each one member of the chaperome subset functional families are shown. Red arrows exemplify HTT-GFP aggregates. Scale bar, 20μm. (See Figure S5).
Figure 6
Figure 6. The Human Chaperome Sub-Network is Repressed in Aging and Disease
A. Extraction of the human orthologous chaperome sub-network from the chaperome interactome shown in Figure 2A, to highlight chaperome sub-network dynamics in human aging brain and neurodegenerative disease. Nodes, edges, shapes and edge strengths as in Figure 2A. B. Human chaperome sub-network superimposed on Venn overlaps of chaperome genes significantly repressed in aging, AD, and HD. C. Graphs show % sub-network (sub-net) vs % non-sub-network (non sub-net) chaperome nodes repressed in human aging brain (SFG) and brains from Alzheimer's (SFG) and Huntington's disease (PFC) patients (See Figure S6). SFG = Superior Frontal Gyrus, PFC = Prefrontal Cortex. D. Venn diagram of overlaps of chaperome sub-network genes significantly repressed in both AD and HD as well as in aging. P values are based on Fisher's exact test, considering only chaperones that are significantly repressed in at least one of the three conditions, aging, AD or HD. The blue overlap area and P value indicate the significance of the overlap of subnetwork genes repressed in all three conditions against the union of sub-network genes repressed in ‘aging only’ and in ‘aging and AD’, the red overlap area and P value indicate the significance of the overlap of sub-network genes repressed in all three conditions against the union of sub-network genes repressed in ‘aging only’ and in ‘aging and HD’.
Figure 7
Figure 7. The Chaperome Sub-Network as Proteostasis Safeguard and its Collapse in Disease
A. Chaperome sub-network action as buffer that safeguards proteostasis from proteotoxic stress, facilitating healthy development and aging. B. Chaperome sub-network perturbation entails proteostasis collapse, exposure to proteotoxicity, accelerated aging and age-onset disease. Perturbation exemplified by loss of edges and repression of gene expression (green nodes).

References

    1. Ahn YY, Bagrow JP, et al. Link communities reveal multiscale complexity in networks. Nature. 2010;466(7307):761–764. - PubMed
    1. Albanese V, Yam AY, et al. Systems analyses reveal two chaperone networks with distinct functions in eukaryotic cells. Cell. 2006;124(1):75–88. - PubMed
    1. Almeida A, Bolanos JP, et al. Cdh1/Hct1-APC is essential for the survival of postmitotic neurons. J Neurosci. 2005;25(36):8115–8121. - PMC - PubMed
    1. Balch WE, Morimoto RI, et al. Adapting proteostasis for disease intervention. Science. 2008;319(5865):916–919. - PubMed
    1. Behrends C, Langer CA, et al. Chaperonin TRiC promotes the assembly of polyQ expansion proteins into nontoxic oligomers. Molecular cell. 2006;23(6):887–897. - PubMed

Publication types

MeSH terms