
Metabolic programming and PDHK1 control CD4+ T cell subsets and inflammation

Valerie A Gerriets et al. J Clin Invest. 2015 Jan.

Abstract

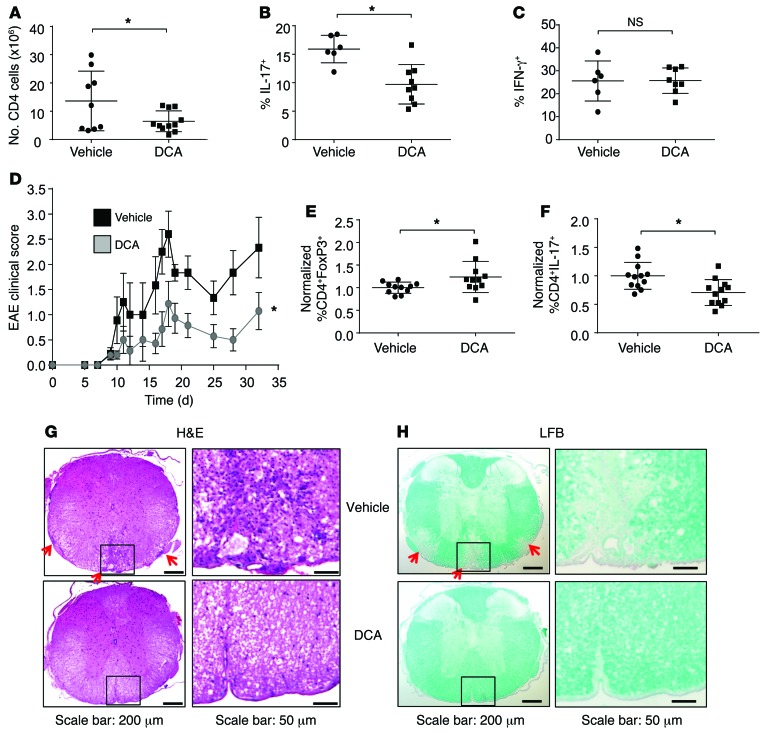
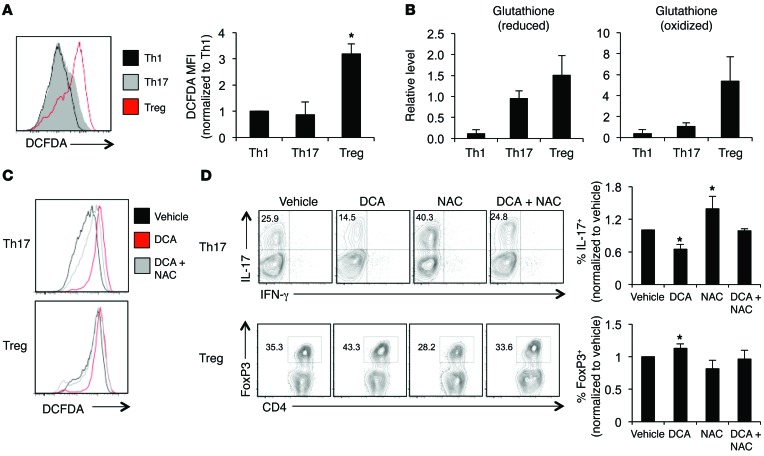
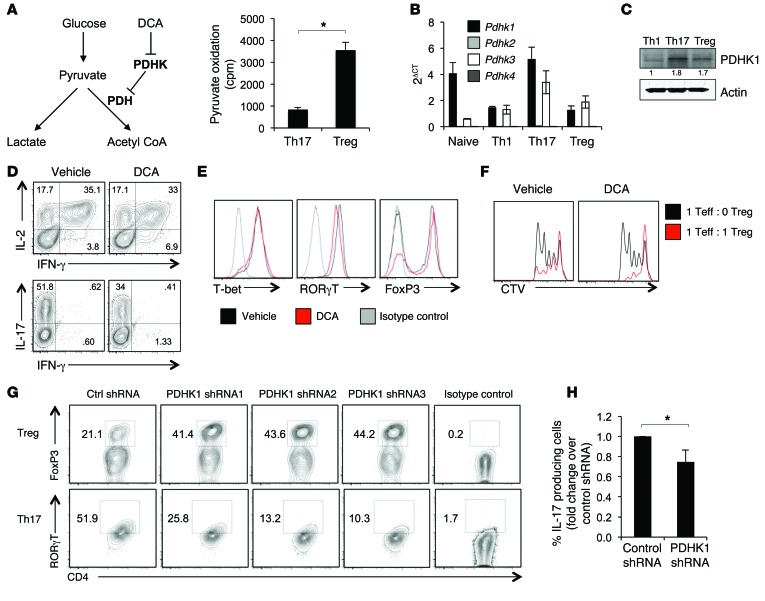
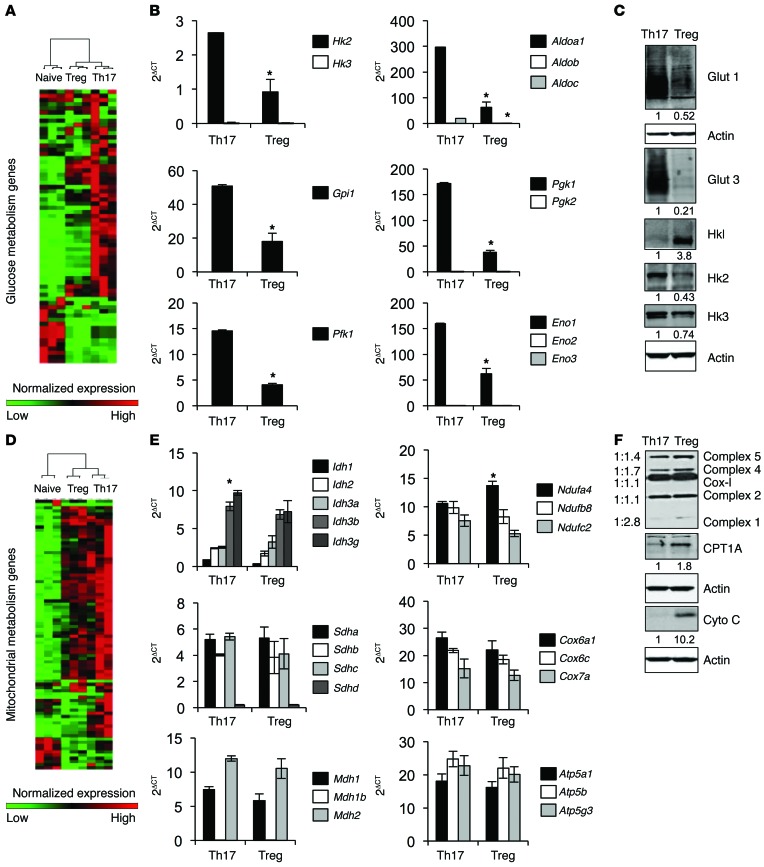
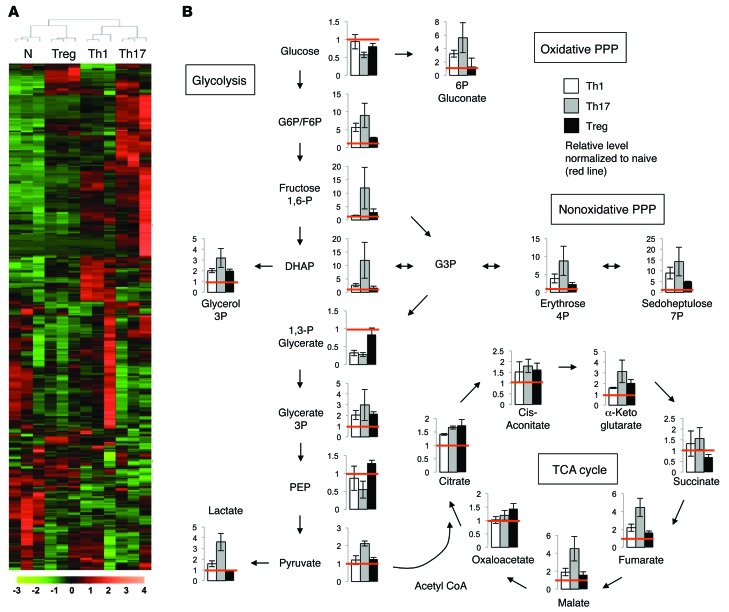
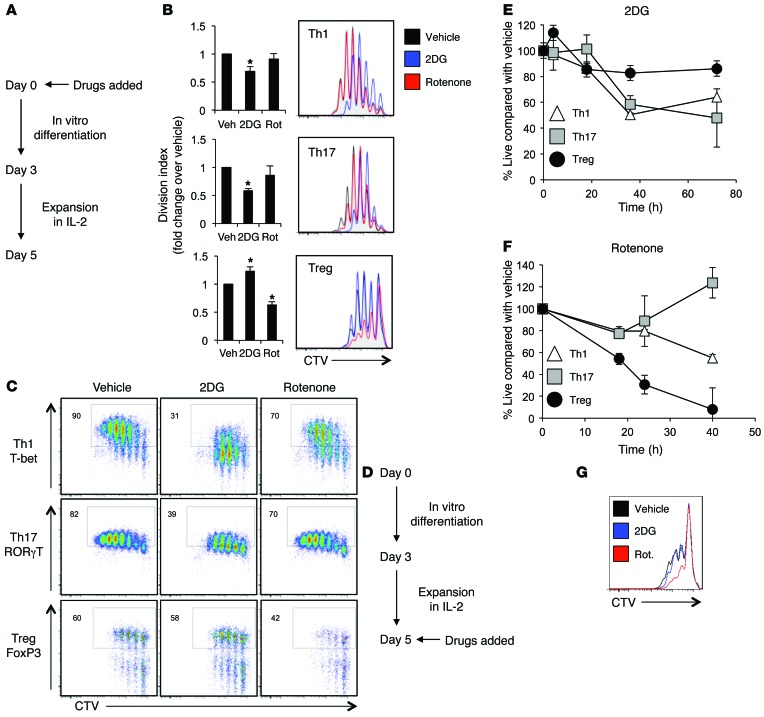
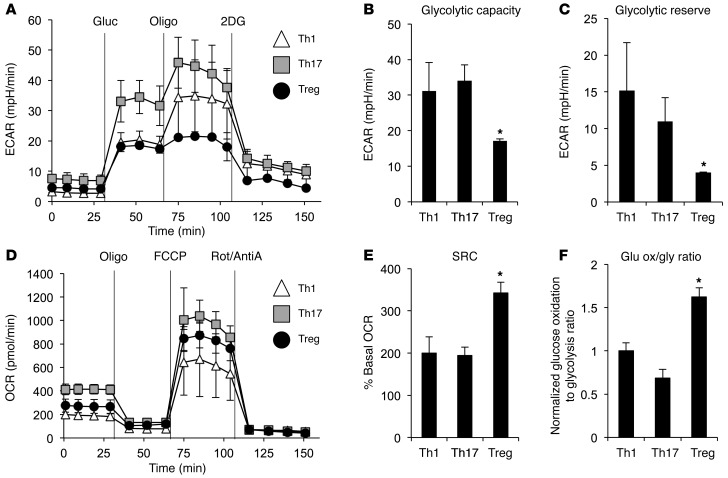
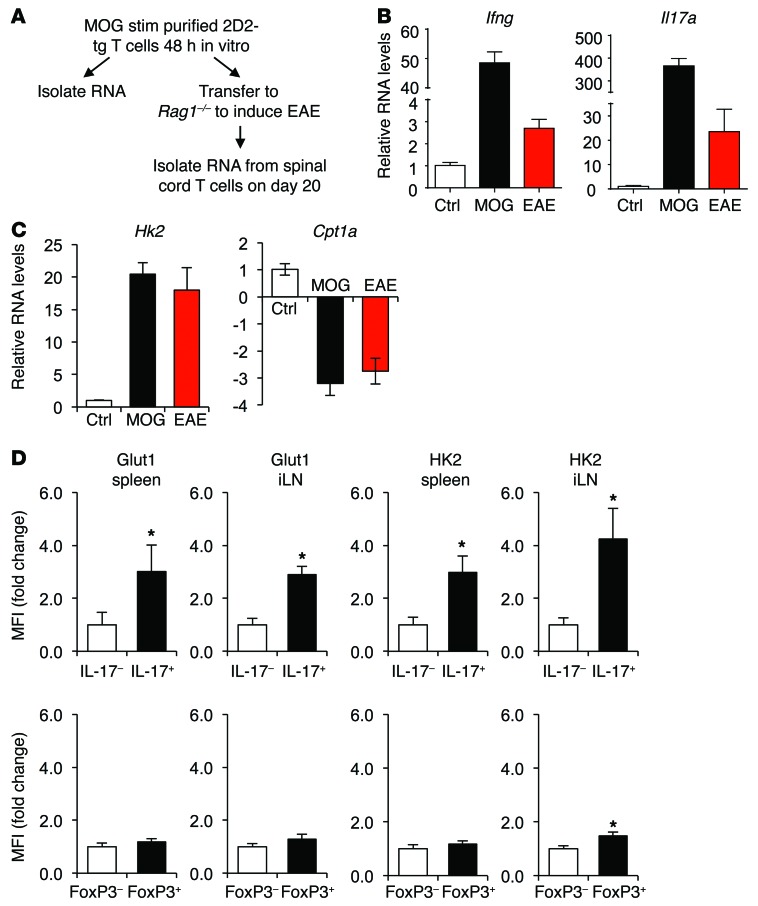
Activation of CD4+ T cells results in rapid proliferation and differentiation into effector and regulatory subsets. CD4+ effector T cell (Teff) (Th1 and Th17) and Treg subsets are metabolically distinct, yet the specific metabolic differences that modify T cell populations are uncertain. Here, we evaluated CD4+ T cell populations in murine models and determined that inflammatory Teffs maintain high expression of glycolytic genes and rely on high glycolytic rates, while Tregs are oxidative and require mitochondrial electron transport to proliferate, differentiate, and survive. Metabolic profiling revealed that pyruvate dehydrogenase (PDH) is a key bifurcation point between T cell glycolytic and oxidative metabolism. PDH function is inhibited by PDH kinases (PDHKs). PDHK1 was expressed in Th17 cells, but not Th1 cells, and at low levels in Tregs, and inhibition or knockdown of PDHK1 selectively suppressed Th17 cells and increased Tregs. This alteration in the CD4+ T cell populations was mediated in part through ROS, as N-acetyl cysteine (NAC) treatment restored Th17 cell generation. Moreover, inhibition of PDHK1 modulated immunity and protected animals against experimental autoimmune encephalomyelitis, decreasing Th17 cells and increasing Tregs. Together, these data show that CD4+ subsets utilize and require distinct metabolic programs that can be targeted to control specific T cell populations in autoimmune and inflammatory diseases.


Figures

Figure 8
Figure 8. PDHK is selectively required for Th17, but not Treg, expansion and function in vivo.
(AC) Rag1–/– mice were injected with naive Teffs (CD4+CD25CD45RBhi), and colitis was induced. Mice were given 2 g/l of DCA (n = 10) or vehicle (n = 10) in the drinking water for the duration of the experiment. (A) The number of CD4+ T cells or (B and C) the percentages of IFN-γ– and IL-17–producing cells in the spleen and mesenteric lymph nodes were determined using flow cytometry. (DH) EAE was induced in wild-type mice with or without DCA treatment (10 mice per group). (D) A time course of clinical scores is shown. (E and F) The percentages of (E) CD4+FoxP3+ and (F) CD4+IL-17+ T cells in the draining lymph nodes on day 9 were determined using flow cytometry. (G) H&E and (H) LFB staining were performed on spinal cord sections from mice with active disease. Data are shown as mean ± SD (AC, E, and F), and data are representative of 3 independent experiments. *P < 0.05.
Figure 7
Figure 7. DCA treatment generates ROS that negatively affects Th17.
CD4+CD25 T cells were polarized in vitro for 3 days, split 1:2, and cultured with IL-2 alone for an additional 2 days to generate Th1, Th17, or Tregs. (A) ROS production was measured by flow cytometry using the indicator dye DCFDA. (B) Relative glutathione levels were measured in the T cell subsets using LC/MS. (C) ROS production in Th17 cells and Tregs treated with vehicle, DCA, or DCA/NAC was measured using DCFDA. (D and E) Tregs and Th17 cells were treated with 10 mM DCA, 1 mM NAC, or both in combination, and (D) IL-17 production and FoxP3 expression were examined after 3 days. Data are shown as mean ± SD of triplicate samples (A, B, and D), and all data are representative of at least 2 independent experiments. *P < 0.05.
Figure 6
Figure 6. PDHK is required for Th17, but not Treg, function in vitro.
CD4+CD25 T cells were polarized in vitro for 3 days, split 1:2, and cultured with IL-2 alone for an additional 2 days to generate Th1, Th17, or Tregs. (A) Schematic showing the different fates of pyruvate and mechanism of DCA inhibition and measurement of 14C-pyruvate oxidation in Th17 cells and Tregs. (B) Real-time PCR and (C) immunoblots are shown, representative of 4 independent experiments. (DF) Cells were treated with 10 mM DCA, and then cytokine production (D) and transcription factor staining (E) were determined by flow cytometry. (F) Treg function was assessed by an in vitro Treg-suppression assay. (G and H) T cells were polarized and infected with lentivirus expressing PDHK1 shRNA. (G) transcription factor staining for FoxP3 and RORγT or (H) intracellular cytokine staining for IL-17 was performed. Data are shown as mean ± SD of triplicate samples (A, B, and H), and all data are representative of at least 3 independent experiments. *P < 0.05.
Figure 5
Figure 5. Th17 cells and Tregs have distinct metabolic gene and protein expression.
CD4+CD25 T cells were polarized in vitro for 3 days, split 1:2, and cultured with IL-2 alone for an additional 2 days to generate Th17 or Tregs for (A, B, D, and E) real-time PCR or (C and F) immunoblot. (A, B, D, and E) Data shown are mean ± SD of 3 biological replicates and are shown as 2ΔCT normalized to the geometric mean of the reference genes Tbp and Bgu. Data are representative of 2 (A, B, D, and E) or 2 (Hk3), 3 (Glut1, Glut3, Hk1, Hk2, OxPhos), 4 (Cyto c), or 5 (Cpt1a) (C and F) independent experiments. *P < 0.05.
Figure 4
Figure 4. Metabolomic profiling of CD4+ subsets shows distinct metabolic profiles.
Naive CD4+CD25 T cells were collected or polarized in vitro for 3 days, split 1:2, and cultured with IL-2 alone for an additional 2 days to generate Th1, Th17, or Tregs. T cell subset lysates from 3 biological replicate samples were extracted and analyzed using high-resolution LC-QE-MS for determination of cellular metabolites. (A) Heat map showing relative levels of each metabolite and unsupervised hierarchical clustering from independent biological replicates. (B) Relative levels of each metabolite in the glycolysis and TCA-cycle pathways are shown. Samples are normalized to naive T cells, as indicated by red lines. Data are shown as mean ± SD of triplicate samples.
Figure 3
Figure 3. Inhibition of glycolysis or mitochondrial electron transport selectively affects Teff or Treg survival, proliferation, and function.
(A) Schematic of drug treatments for B and C. (B and C) CD4+CD25 T cells were labeled with CTV and polarized in vitro for 3 days to generate Th1 or Th17 cells or Tregs. Cells were treated with 250 μM 2DG or 5 nM rotenone, and (B) proliferation or (C) transcription factor staining was assessed by flow cytometry after 72 hours. (D) Schematic of drug treatments for E and F. (E and F) CD4+CD25 T cells were polarized in vitro for 3 days, split 1:2, and cultured with IL-2 alone for an additional 2 days and then incubated with (E) 250 μM 2DG or (F) 5 nM rotenone; survival was determined by propidium iodide exclusion relative to vehicle-treated control. (G) CD4+CD25+ natural Tregs were labeled with CTV and activated in the presence of 250 μM 2DG or 5 nM rotenone, and proliferation was assessed by CTV dilution. Data are shown as mean ± SD of triplicate samples (B, E, and F), and all data are representative of at least 3 independent experiments. *P < 0.05.
Figure 2
Figure 2. Teffs and Tregs utilize different metabolic pathways and have distinct fuel capacities.
CD4+CD25 T cells were polarized in vitro for 3 days, split 1:2, and cultured with IL-2 alone for an additional 2 days to generate induced Th1 or Th17 cells or Tregs. (AC) T cells were cultured in base DMEM media with no glucose or glutamine. ECAR was assessed after the addition of 25 mM glucose (gluc) and in response to the metabolic inhibitors oligomycin (oligo) and 2DG. Shown are the (A) time course and calculations of (B) glycolytic capacity and (C) glycolytic reserve. (D and E) T cells were cultured in base DMEM media with 25 mM glucose. OCR was assessed basally and in response to the mitochondrial inhibitors oligomycin, FCCP, and rotenone and antimycin A (Rot/AntiA). Shown are the (D) time course and (E) calculation of SRC. (F) Glucose oxidation was measured in the T cell subsets, and the ratio of glucose oxidation to glycolysis was graphed. Data are shown as mean ± SD of triplicate samples (B, C, E, and F), and all data are representative of at least 3 independent experiments. *P < 0.05.
Figure 1
Figure 1. Teffs, but not Tregs, upregulate glycolytic metabolism during inflammatory processes in vivo.
(AC) EAE was induced in 2D2 TCR transgenic mice, and RNA was extracted from spinal cords of mice with active disease or in vitro MOG-stimulated (MOG stim) 2D2 T cells as indicated (A) for real-time PCR of (B) inflammatory and (C) metabolic gene expression. (D) EAE was induced in wild-type mice and CD4+ T cells in spleens, and inguinal lymph nodes of mice with active disease were examined using flow cytometry. Data are representative of 2 experiments (AC, n = 10; D, n = 5) and shown as mean ± SD. *P < 0.05.

References

    1. Zhu J, Yamane H, Paul WE. Differentiation of effector CD4 T cell populations. Annu Rev Immunol. 2010;28:445–489. doi: 10.1146/annurev-immunol-030409-101212. - DOI - PMC - PubMed
    1. Buckner JH. Mechanisms of impaired regulation by CD4CD25(+)FOXP3(+) regulatory T cells in human autoimmune diseases. Nat Rev Immunol. 2010;10(12):849–859. doi: 10.1038/nri2889. - DOI - PMC - PubMed
    1. Cua DJ, et al. Interleukin-23 rather than interleukin-12 is the critical cytokine for autoimmune inflammation of the brain. Nature. 2003;421(6924):744–748. doi: 10.1038/nature01355. - DOI - PubMed
    1. Yen D, et al. IL-23 is essential for T cell-mediated colitis and promotes inflammation via IL-17 and IL-6. J Clin Invest. 2006;116(5):1310–1316. doi: 10.1172/JCI21404. - DOI - PMC - PubMed
    1. Serody JS, Hill GR. The IL-17 differentiation pathway and its role in transplant outcome. Biol Blood Marrow Transplant. 2012;18(1 suppl):S56–S61. - PMC - PubMed

Publication types

MeSH terms

Substances