Comparative Study
. 2015 Jan;33(1):58-63.
doi: 10.1038/nbt.3070. Epub 2014 Dec 1.

A comparison of non-integrating reprogramming methods

Affiliations
Comparative Study

A comparison of non-integrating reprogramming methods

Thorsten M Schlaeger et al. Nat Biotechnol. 2015 Jan.

Abstract

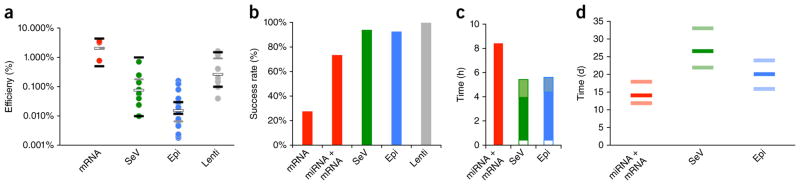
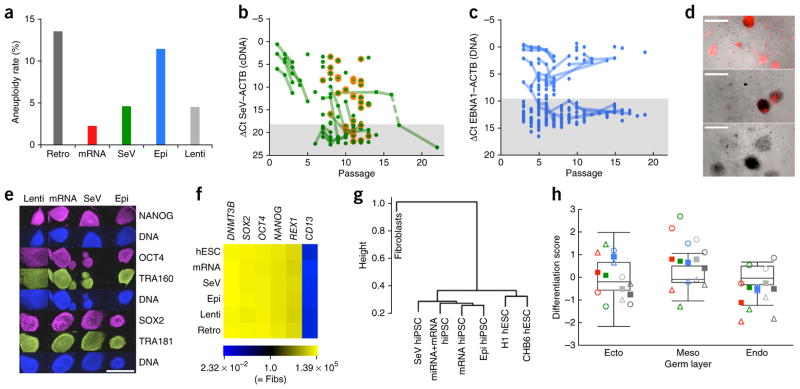
Human induced pluripotent stem cells (hiPSCs) are useful in disease modeling and drug discovery, and they promise to provide a new generation of cell-based therapeutics. To date there has been no systematic evaluation of the most widely used techniques for generating integration-free hiPSCs. Here we compare Sendai-viral (SeV), episomal (Epi) and mRNA transfection mRNA methods using a number of criteria. All methods generated high-quality hiPSCs, but significant differences existed in aneuploidy rates, reprogramming efficiency, reliability and workload. We discuss the advantages and shortcomings of each approach, and present and review the results of a survey of a large number of human reprogramming laboratories on their independent experiences and preferences. Our analysis provides a valuable resource to inform the use of specific reprogramming methods for different laboratories and different applications, including clinical translation.


Conflict of interest statement

COMPETING FINANCIAL INTERESTS

The authors declare no competing financial interests.

Figures

Figure 1
Figure 1
Performance comparison of non-integrating reprogramming methods. (a) Reprogramming efficiencies were calculated as the number of emerging hiPSC colonies per starting cell number; each dot represents the average efficiency of one sample. White bars indicate the mean efficiencies of successful experiments; black bars show the range of efficiencies reported in independent publications (see text); gray bars represent the method-specific means of the three samples that were reprogrammable by all methods. The number of biological replicates was n = 3 samples (a total of 11 biological replicates) for RNA, n = 9 (10) for SeV, n = 17 (25) for Epi and n = 9 (9) for Lenti. (b) Reprogramming success rates for human fibroblast reprogramming experiments using standard protocols. Only experiments yielding at least three colonies were counted as successes. The number of independent samples (biological replicates) was n = 11 for mRNA, 15 for miRNA + mRNA, 85 for SeV, 28 for Epi and 13 for Lenti. (c) Typical total hands-on workload (in hours) was assessed for the three non-integrating human fibroblast-reprogramming methods, until colonies have emerged and grown to a size large enough for picking. The Epi and SeV methods have higher starting cell requirements than the miRNA + mRNA method; the time required to perform the necessary additional somatic cell expansion is shown as a white box. Epi and SeV lines need to be tested for the absence of the reprogramming agents; shaded boxes indicate the workloads of nucleic acid isolation and analysis. (d) Skin fibroblast-reprogramming times (in days), from the first transfection and/or transduction until colonies are ready for picking. Bars show the observed range (light band) and average (dark band) for each method (n = 10 biological replicates for miRNA + mRNA, 44 for SeV and 12 for Epi). All pairwise comparisons reached statistical significance (Student’s t-test, P < 0.01).
Figure 2
Figure 2
Comparison of the genetic integrity of hiPSCs derived by different reprogramming methods. (a) Aneuploidy rates of low-passage (P < 30) hiPSC lines derived by different reprogramming methods. The data include only standard reprogramming methods and the results from the lowest available passage for each hiPSC line. All observed abnormal karyotypes are listed in Supplementary Figure 1a. Donor age did not contribute to the increased rate of aneuploidy among Epi hiPSCs (data not shown). n = 192 (Retro), 44 (mRNA), 151 (SeV), 61 (Epi), 22 (Lenti). (b) Quantification of SeV (Cytotune) RNA in SeV hiPSC lines at different passages by TaqMan RT-QPCR analysis. Ct values for ACTB were subtracted from those for SeV. Lines connect data points that represent the same stem cell line over time. A 5-day heat treatment (39 °C) was performed between collections of the samples connected by the dashed line. The shaded area marks the detection limit (3 s.d. removed from the mean of the SeV-negative controls (n = 10)). Orange circles highlight erythroblast-derived SeV hiPSC samples showing a slightly delayed loss of SeV RNA. Cytotune2 SeV RNA loss kinetics are shown in Supplementary Figure 2a. (c) Quantification of EBNA1 DNA in Epi hiPSC lines at different passages by TaqMan QPCR analysis. Ct values for RNAseP (single-copy control gene locus) were subtracted from those for EBNA1. Lines connect data points that represent the same stem cell line over time. The shaded area marks the detection limit (3 s.d. removed from the mean of the EBNA1-negative controls (n = 41)). See also Supplementary Figure 2b. (d) Epi hiPSCs (passage 3) generated with a modified OCT4-p53 plasmid containing a H2B-mKO2 cassette for fluorescent labeling of hiPSCs that have retained this plasmid (shown are examples of lines containing varying amounts of H2B-mKO2; some dead show auto-fluorescence). Scale bars, 1,000 μm. (e) Immunofluorescence analysis of hiPSC lines representing the indicated reprogramming methods. Scale bar, 1,000 μm. (f) Quantitative RT-PCR analysis (passage 10–15) of fibroblast and pluripotency marker gene expression in parental fibroblasts and hiPSCs, derived by the indicated methods. Heat map representation of the average fold-induction and fold-repression (compared to fibroblasts) of GAPDH-normalized expression levels of three hiPSC lines per method (three technical replicates per line). Additional genes are shown in Supplementary Figure 3. (g) Hierarchical cluster analysis of CpG genomic DNA methylation levels of partially methylated domains in method-specific hiPSC (passage 11–21) and control cells (Supplementary Fig. 4). (h) Comparison of the scorecard differentiation propensity of method-specific hiPSC lines (passage 15–27). Boxplots show the distribution of differentiation propensities for the pluripotent reference set (hESCs); circles = BJ-derived hiPSCs, triangles = PS1-derived hiPSCs; solid squares = method-specific score averages; for each germ layer, method-specific hiPSC scorecard data are shown (from left to right) for mRNA (red), SeV (green), Epi (blue), Lenti (light gray) and Retro hiPSCs (dark gray). None of the pairwise scorecard-score comparisons (mRNA vs. Epi, mRNA vs. SeV, Epi vs. SeV) reached statistical significance (Student’s t-test, P > 0.5).

References

    1. Takahashi K, et al. Induction of pluripotent stem cells from adult human fibroblasts by defined factors. Cell. 2007;131:861–872. - PubMed
    1. Yu J, et al. Induced pluripotent stem cell lines derived from human somatic cells. Science. 2007;318:1917–1920. - PubMed
    1. Park IH, et al. Reprogramming of human somatic cells to pluripotency with defined factors. Nature. 2008;451:141–146. - PubMed
    1. Fusaki N, et al. Efficient induction of transgene-free human pluripotent stem cells using a vector based on Sendai virus, an RNA virus that does not integrate into the host genome. Proc Jpn Acad, Ser B, Phys Biol Sci. 2009;85:348–362. - PMC - PubMed
    1. Okita K, et al. A more efficient method to generate integration-free human iPS cells. Nat Methods. 2011;8:409–412. - PubMed

Publication types

MeSH terms