Review
. 2014 Nov;3(6):407-19.
doi: 10.2217/cns.14.44.

Benefits of dynamic susceptibility-weighted contrast-enhanced perfusion MRI for glioma diagnosis and therapy

Affiliations
Review

Benefits of dynamic susceptibility-weighted contrast-enhanced perfusion MRI for glioma diagnosis and therapy

Ramon Francisco Barajas Jr et al. CNS Oncol. 2014 Nov.

Abstract

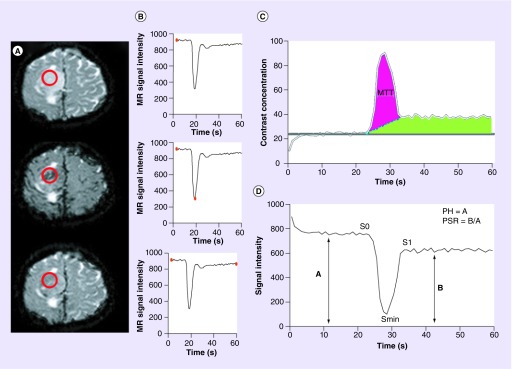
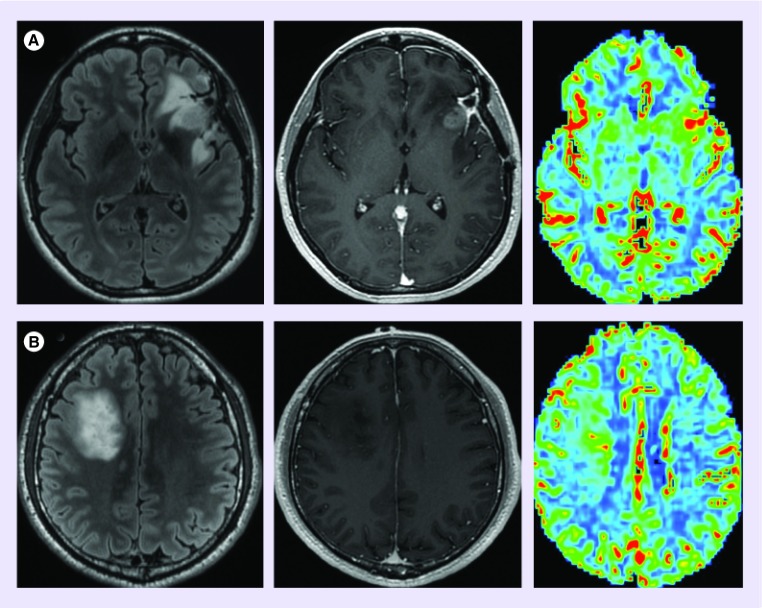
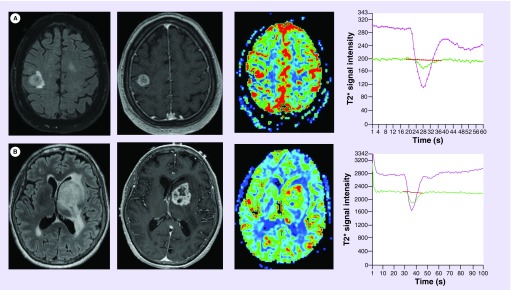
Glioma are the most common supra-tentorial brain tumor in the USA with an estimated annual incidence of 17,000 new cases per year. Dynamic susceptibility-weighted contrast-enhanced (DSC) perfusion MRI noninvasively characterizes tumor biology allowing for the diagnosis and therapeutic monitoring of glioma. This MRI technique utilizes the rapid changes in signal intensity caused by a rapid intravascular bolus of paramagnetic contrast agent to calculate physiologic perfusion metrics. DSC perfusion MRI has increasingly become an integrated part of glioma imaging. The specific aim of this article is to review the benefits of DSC perfusion MRI in the therapy of glioma.

Keywords: cerebral blood volume; dynamic susceptibility-weighted contrast-enhanced perfusion MRI; glioblastoma; glioma; imaging genomics; metastasis; molecular imaging; peak height; percentage of signal intensity recovery.


Conflict of interest statement

Financial & competing interests disclosure

This work was supported by 5T32EB001631-07 from the NIH. The authors have no other relevant affiliations or financial involvement with any organization or entity with a financial interest in or financial conflict with the subject matter or materials discussed in the manuscript apart from those disclosed.

No writing assistance was utilized in the production of this manuscript.

Figures

<b>Figure 1.</b>
Figure 1.. Calculation of dynamic susceptibility-weighted contrast-enhanced perfusion MRI parameters; peak height, percentage of signal intensity recovery and cerebral blood volume.
(A & B) Precontrast bolus (top), peak bolus (middle), and post-contrast bolus (bottom) T2* axial images from a patient with right convexity glioma. (A) Demonstrates the changes in signal intensity (darkened vasculature) caused by the rapid intravascular bolus of paramagnetic contrast agents. Placement of a region of interest (red circle) over the lesion allows for the measurement of signal intensity (B) at any given time point during dynamic imaging sequence (red dot on graph bar). Generation of (C) a contrast concentration–time and (D) signal intensity–time curves allows for the quantification of perfusion metrics. (C) Idealized illustration of cerebral blood volume quantification in the setting of a disrupted blood–brain barrier. Two quantification methods are depicted. Baseline subtraction method (blue dashed line) can be applied allowing for the calculation of cerebral blood volume which is proportional to the area under the concentration–time curve (purple shaded area). Alternatively, the negative enhancement integral method utilizes the contrast concentration prior to the bolus phase of imaging (gray bar) to estimate the end bolus contrast concentration and calculates the area within the first pass bolus of contrast without consideration of the recirculation phase (green shaded area). Mean transit time is calculated as the half width maximum of the contrast concentration-time curve (gray bars). (D) PH is calculated as S0–Smin, where S0 is the precontrast bolus baseline signal intensity and Smin is the minimum signal intensity obtained during the first pass bolus phase of contrast (double-headed arrow A). PSR is calculated as (S1–Smin/S0–Smin), where S1 is the average post-bolus signal intensity (double-headed arrow B). For color images please see online http://www.futuremedicine.com/doi/full/10.2217/cns.14.44 MR: Magnetic resonance; PH: Peak height; PSR: Percentage of signal intensity recovery.
<b>Figure 2.</b>
Figure 2.. MRI-guided tissue sampling demonstrates glioblastoma biological heterogeneity.
(A & B) Similar appearing contrast-enhancing foci (first row, yellow circle, [A]; green circle, [B]) demonstrates dissimilar biological features of glioblastoma aggressiveness. (A) Enhancing tissue sampling site with mildly elevated cerebral blood volume (CBV) and peak height (second row, axial CBV map reformation, purple regions of interest corresponds to tissue sampling site) demonstrates simple microvascular hyperplasia (third row, factor VIII brown stained cells) without elevation of cellular proliferation (fourth row, Ki-67 proliferative index less than 1%). (B) Similar appearing enhancing foci demonstrates markedly increased CBV and peak height with complex glomeruloid microvascular hyperplasia (factor VIII brown stained cells) with elevated cellular proliferation (Ki-67 proliferative index of 20%). This case demonstrates the nonspecificity of contrast enhancement and the additional value of dynamic susceptibility-weighted contrast-enhanced perfusion MRI metrics for the selection of biologically aggressive tumor sites. Pathologic images courtesy of Joanna J Phillips (Departments of Pathology and Neurological Surgery, University of California, San Francisco, CA, USA).
<b>Figure 3.</b>
Figure 3.. Dynamic susceptibility-weighted contrast-enhanced perfusion metrics differentiate intracranial metastatic disease from gliomblastoma.
Axial T1 postcontrast-enhanced (left) and T2 (top middle) fluid-attenuated inversion recovery (bottom middle) images demonstrate similar appearing lesions. Signal intensity–time curves (right) generated from lesion wide region of interest (not shown) in a patient with (A) metastatic lung cancer and (B) glioblastoma differentiates disease etiology utilizing perfusion metrics. Metastatic lesion demonstrates markedly reduced percentage of signal intensity ([A] purple curve) when compared with normal appearing white matter ([A] green curve) and glioblastoma ([B] purple curve). Additionally, cerebral blood volume and peak height measurements are elevated within glioblastoma when compared with metastatic lesions. For color images please see online at http://www.futuremedicine.com/doi/full/10.2217/cns.14.44
<b>Figure 4.</b>
Figure 4.. Cerebral blood volume differentiates high from low-grade glioma.
(A) Diffuse astrocytoma (WHO grade II) is morphologically manifested as a fluid-attenuated inversion recovery hyperintense (FLAIR; left) nonenhancing (middle) mass with cerebral blood volume (right) measurements similar to normal appearing white matter. (B) Anaplastic astrocytoma (WHO grade 3) typically presents as a FLAIR hyperintense mass with minimal if any contrast enhancement; however, unlike low-grade glioma, demonstrates elevated cerebral blood volume. The presence of increased perfusion metrics within a nonenhancing glioma suggests the presence of aggressive biological features that portend a high-grade diagnosis. (C) glioblastoma (WHO grade 4) can present as a rim enhancing T2/FLAIR hyperintense mass with markedly elevated cerebral blood volume.
<b>Figure 5.</b>
Figure 5.. Oligodenroglial tumors demonstrate elevated cerebral blood volume.
(A & B) Fluid-attenuated inversion recovery hyperintense (left) enhancing 1p19q codeleted ([A] middle) and nonenhancing 1p19q intact ([B] middle) grade 2 oligodendroglioma demonstrates mildly elevated cerebral blood volume when compared with diffuse astrocytoma (Figure 4). Also demonstrated is the tendency for oligodenroglial tumors with the prognostically favorable 1p19q codeleted (A) molecular marker status to express higher cerebral blood volume when compared with tumors with intact 1p19q status. Prior studies have suggested that dynamic susceptibility-weighted contrast-enhanced perfusion MRI may be a noninvasive biomarker of 1p19q genotype.
<b>Figure 6.</b>
Figure 6.. EGFR-mutated primary glioblastoma demonstrates differential dynamic susceptibility-weighted contrast-enhanced perfusion metrics.
(A) Fluid-attenuated inversion recovery (left) and T1-weighted postcontrast (middle left) images demonstrate a rim enhancing mass found to represent an EGFR-mutated primary glioblastoma. Cerebral blood volume map (middle right) and signal intensity–time curve (right) demonstrates markedly elevated relative cerebral blood volume (8.2) and relative peak height (9.2) about the enhancing foci. (B) Fluid-attenuated inversion recovery and T1-weighted post contrast images demonstrate a similar appearing rim enhancing mass found to represent a primary glioblastoma without EGFR mutation. Cerebral blood volume map and signal intensity–time curve demonstrates moderately elevated relative cerebral blood volume (3.7) and relative peak height (2.7) about the enhancing foci. While both tumors demonstrates elevated dynamic susceptibility-weighted contrast-enhanced perfusion metrics, the EGFR-mutated tumor does so to a significantly higher degree.

Similar articles

Cited by

References

    1. Porter KR, McCarthy BJ, Freels S, Kim Y, Davis FG. Prevalence estimates for primary brain tumors in the United States by age, gender, behavior, and histology. Neuro Oncol. 2010;12(6):520–527. - PMC - PubMed
    1. Omuro A1, DeAngelis LM. Glioblastoma and other malignant gliomas: a clinical review. JAMA. 2013;310(17):1842–1850. - PubMed
    1. Aronen HJ, Gazit IE, Louis DN, et al. Cerebral blood volume maps of gliomas: comparison with tumor grade and histologic findings. Radiology. 1994;191:41–51. - PubMed
    1. Knopp EA, Cha S, Johnson G, et al. Glial neoplasms: dynamic contrast-enhanced T2*-weighted MR imaging. Radiology. 1999;211:791–798. - PubMed
    1. Cha S, Knopp EA, Johnson G, et al. Dynamic contrast-enhanced T2-weighted MR imaging of recurrent malignant gliomas treated with thalidomide and carboplatin. Am. J. Neuroradiol. 2000;21:881–890. - PMC - PubMed

Publication types