. 2014 Dec;62(12):2235-42.
doi: 10.1111/jgs.13130. Epub 2014 Nov 29.

Trends in kidney transplant outcomes in older adults

Affiliations

Trends in kidney transplant outcomes in older adults

Mara A McAdams-DeMarco et al. J Am Geriatr Soc. 2014 Dec.

Abstract

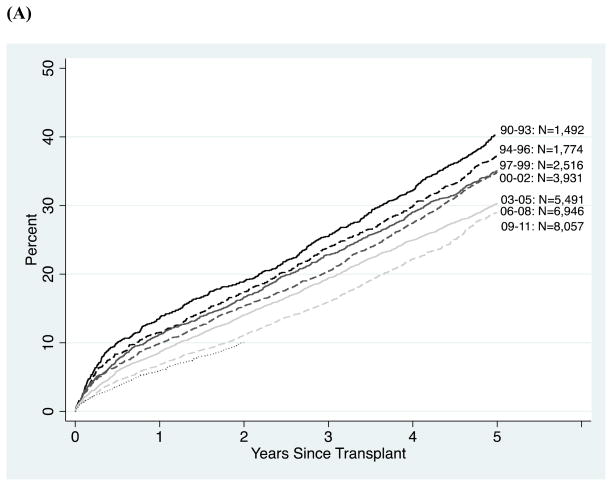
Objectives: To estimate mortality and death-censored graft loss according to year of kidney transplant (KT) between 1990 and 2011.

Design: Cohort study.

Setting: The Scientific Registry of Transplant Recipients (SRTR).

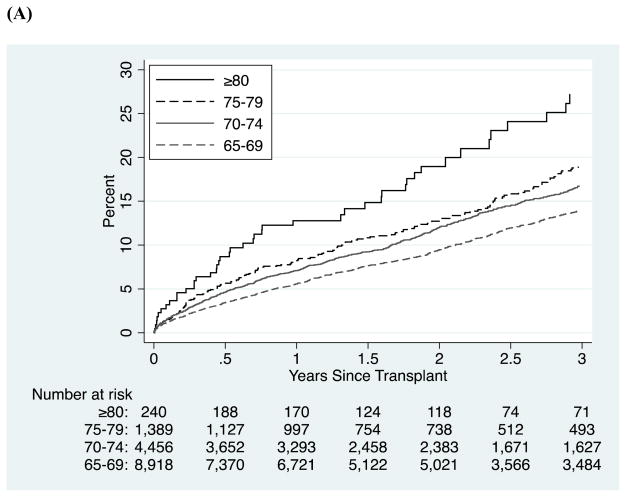
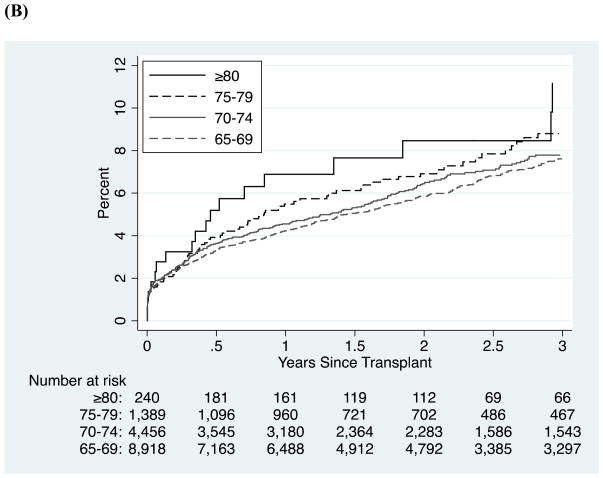
Participants: KT recipients aged 65 and older at the time of transplantation (N = 30,207).

Measurements: Mortality and death-censored graft loss ascertained through center report and linkage to Social Security Death Master File and to Medicare.

Results: Older adults currently account for 18.4% of KT recipients, up from 3.4% in 1990; similar increases were noted for deceased donor (5.4 times percentage increase) and live donor (9.1 times percentage increase) transplants. Current recipients are not only older, but also more likely to be female and African American, have lengthier pretransplant dialysis, have diabetes mellitus or hypertension, and receive marginal kidneys. Mortality for older deceased donor recipients between 2009 and 2011 was 57% lower (hazard ratio (HR) = 0.43, 95% confidence interval (CI) = 0.33-0.56, P < .001) than between 1990 and 1993; mortality for older live donor recipients was 50% lower (HR = 0.50, 95% CI = 0.36-0.68, P < .001). Death-censored graft loss for older deceased donor recipients between 2009 and 2011 was 65% lower (HR = 0.35, 95% CI = 0.29-0.42, P < .001) than between 1990 and 1993; death-censored graft loss for older live donor recipients was 59% lower (HR = 0.41, 95% CI = 0.24-0.70, P < .001).

Conclusion: Despite a major increase in number of older adults transplanted and an expanding window of transplant eligibility, mortality and graft loss have decreased substantially for this recipient population. These trends are important to understand for patient counseling and transplant referral.

Keywords: graft loss; kidney transplantation; mortality; older adults.


Conflict of interest statement

Conflict of Interest: Authors have no conflict of interest to report.

Figures

Figure 1
Figure 1. Older Kidney Transplant Recipients (A) and the Cumulative Distribution of Age at Kidney Transplantation (B), by Year of Transplantation
(A) The number of older kidney transplantation (KT) recipients is shown as a bar (1st y-axis), and the percentage of total kidney transplant recipients in that year comprised of adults ages 65 and older is shown as a line (2nd y-axis).(B)For all transplant recipients between 1990–2011, the nested cumulative distribution of age at the time of kidney transplantation by year of transplantation is displayed. The further the curve is to the right, the older the age distribution at that time. KT=kidney transplantation.
Figure 2
Figure 2. Mortality (A), Death-Censored Graft Loss (B), and All Cause Graft Loss (Death or Mortality) (C) Among Older Kidney Transplantation Recipients, by Year of Transplant
The year and number of older recipients are listed to the right of the curve. The curves for 2009–2011 stop at 2 years because only 2 years of available follow-up are available for this cohort of older KT recipients.
Figure 3
Figure 3. Mortality (A), Death-Censored Graft Loss (B), and Cumulative Incidence of Graft Loss (C) for Older Kidney Transplant Recipients between 2006–2011, by Age
Mortality and death-censored graft loss were estimated using Kaplan-Meier methods. The cumulative incidence of graft loss was estimated using a nonparametric method which treats death as a competing risk.

Comment in

References

    1. United States Renal Data System. 2012 Annual Data Report: Atlas of Chronic Kidney Disease and End-Stage Renal Disease in the United States. Bethesda: National Institute of Diabetes and Digestive and Kidney Diseases; 2012.
    1. Eggers PW. The aging pandemic: Demographic changes in the general and end-stage renal disease populations. SemNeph. 2009;29:551–554. - PubMed
    1. Huang E, Segev DL, Rabb H. Kidney transplantation in the elderly. Semin Nephrol. 2009;29:621–635. - PMC - PubMed
    1. Grams ME, Kucirka LM, Hanrahan CF, et al. Candidacy for kidney transplantation of older adults. J Am Geriatr Soc. 2012;60:1–7. - PMC - PubMed
    1. Takiff H, Mickey MR, Terasaki PI. Factors important in 10-year kidney transplant survival. Clin Transpl. 1986:157–164. - PubMed

Publication types