Multicenter Study
. 2014 Dec;7(12):1221-35.
doi: 10.1016/j.jcmg.2014.07.017. Epub 2014 Nov 5.

Visceral adiposity and the risk of metabolic syndrome across body mass index: the MESA Study

Affiliations
Multicenter Study

Visceral adiposity and the risk of metabolic syndrome across body mass index: the MESA Study

Ravi V Shah et al. JACC Cardiovasc Imaging. 2014 Dec.

Abstract

Objectives: This study sought to evaluate differential effects of visceral fat (VF) and subcutaneous fat and their effects on metabolic syndrome (MetS) risk across body mass index (BMI) categories.

Background: The regional distribution of adipose tissue is an emerging risk factor for cardiometabolic disease, although serial changes in fat distribution have not been extensively investigated. VF and its alterations over time may be a better marker for risk than BMI in normal weight and overweight or obese individuals.

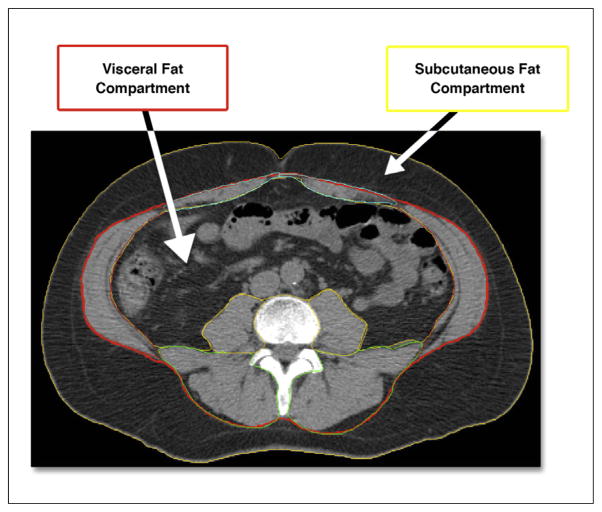
Methods: We studied 1,511 individuals in the MESA (Multi-Ethnic Study of Atherosclerosis) with adiposity assessment by computed tomography (CT). A total of 253 participants without MetS at initial scan underwent repeat CT (median interval 3.3 years). We used discrete Cox regression with net reclassification to investigate whether baseline and changes in VF area are associated with MetS.

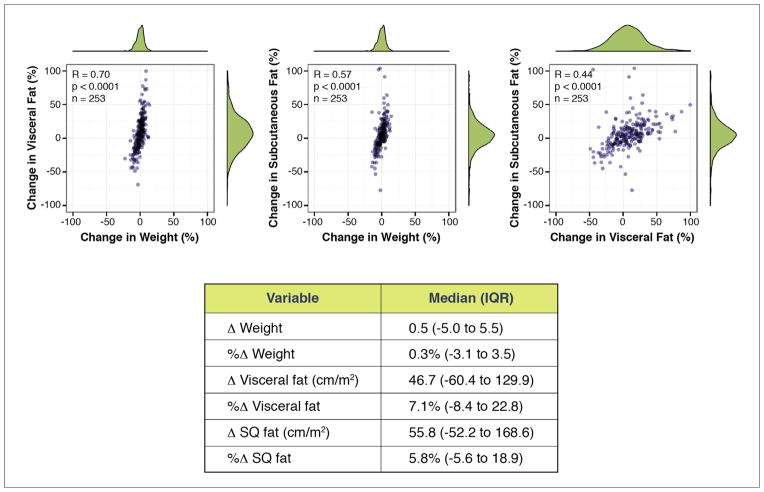
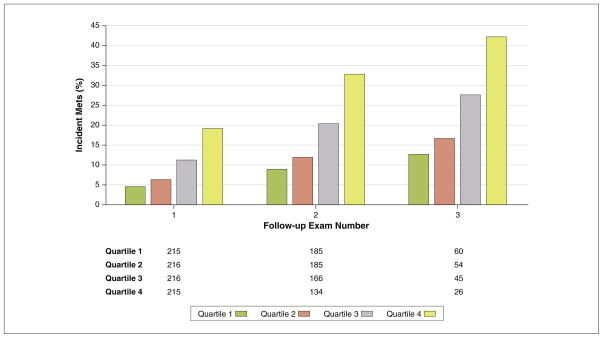
Results: Higher VF was associated with cardiometabolic risk and coronary artery calcification, regardless of BMI. After adjustment, VF was more strongly associated with incident MetS than subcutaneous fat regardless of weight, with a 28% greater MetS hazard per 100 cm(2)/m VF area and significant net reclassification (net reclassification index: 0.44, 95% confidence interval [CI]: 0.29 to 0.60) over clinical risk. In individuals with serial imaging, initial VF (hazard ratio: 1.24 per 100 cm(2)/m, 95% CI: 1.08 to 1.44 per 100 cm(2)/m, p = 0.003) and change in VF (hazard ratio: 1.05 per 5% change, 95% CI: 1.01 to 1.08 per 5% change, p = 0.02) were associated with MetS after adjustment. Changes in subcutaneous fat were not associated with incident MetS after adjustment for clinical risk and VF area.

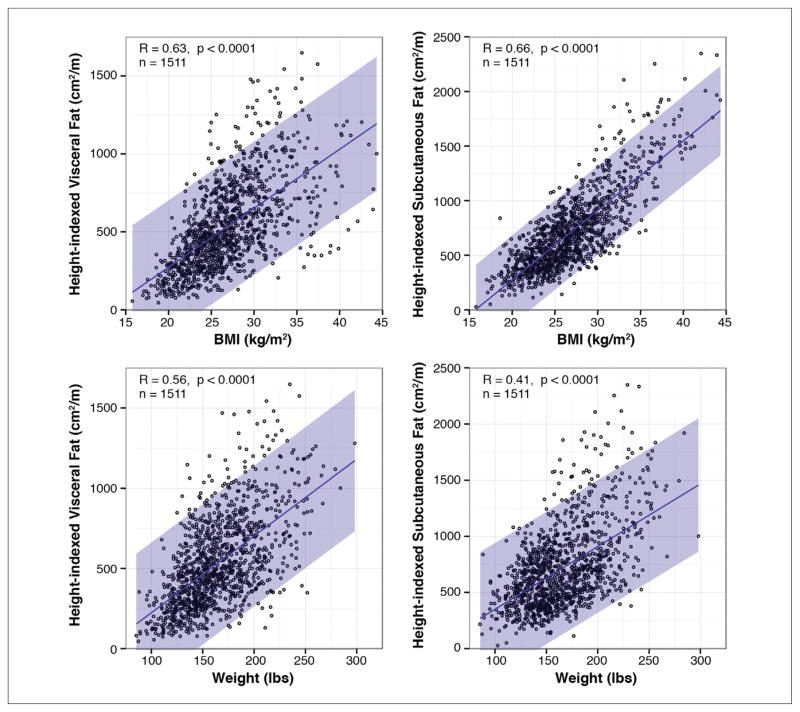
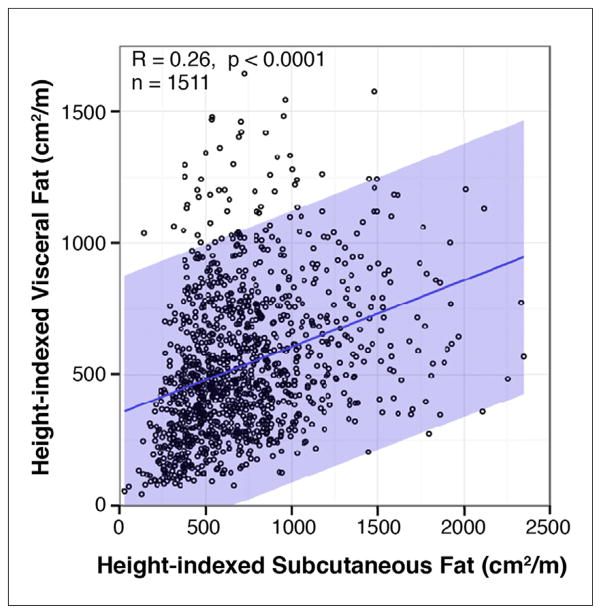
Conclusions: VF is modestly associated with BMI. However, across BMI, a single measure of and longitudinal change in VF predict MetS, even accounting for weight changes. Visceral adiposity is essential to assessing cardiometabolic risk, regardless of age, race, or BMI, and may serve as a marker and target of therapy in cardiometabolic disease.

Keywords: cardiometabolic risk; metabolic syndrome; obesity.


Figures

FIGURE 1
FIGURE 1. Diagram of Visceral and Subcutaneous Fat Compartments Analyzed by CT Imaging in MESA
A description of the delineation of these compartments is provided in the text. CT = computed tomography; MESA = Multi-Ethnic Study of Atherosclerosis.
FIGURE 2
FIGURE 2. Evolution of Metabolic Risk Factors From Index MESA Examination (Time of CT for Visceral Fat Assessments) to More Follow-Up Study Visits
Higher visceral adiposity was associated with worse risk factor profile (p < 0.0001 for visceral adiposity). Over time, systolic blood pressure (BP) and glucose control worsened (p = 0.04 and p < 0.0001, respectively). In contrast, triglycerides and high-density lipoprotein (HDL) improved over time (p = 0.0001 and p < 0.0001). There was no evidence of different risk factor trajectories for those with high or low visceral fat, except for triglycerides (interaction p = 0.004). All analyses were performed with longitudinal mixed effect models with per subject random intercepts. Abbreviations as in Figure 1.
FIGURE 3
FIGURE 3. Scatterplots and Spearman Correlation Between Height-Indexed Visceral Fat Area and Height-Indexed Subcutaneous Fat Area With BMI and Weight
Visceral fat associations are shown on the left and subcutaneous fat associations are on the right. Visceral fat area is expressed as cm2/m. BMI = body mass index.
FIGURE 4
FIGURE 4. Scatterplot and Correlation Between Height-Indexed Visceral Fat Area and Height-Indexed Subcutaneous Fat Area
The blue band represents 95% prediction limits for the estimated regression line.
FIGURE 5
FIGURE 5. Longitudinal Associations Between Percent Change in Visceral Fat, Subcutaneous Fat, and Weight
The underlying distribution of these changes is shown along each axis as a density function. Bivariate correlation between each measure is displayed on the plot with corresponding p value (Spearman). The table provides the median and interquartile range (IQR) for change in each variable. SQ = subcutaneous.
FIGURE 6
FIGURE 6. Cumulative Incidence of MetS by Discrete-Time Cox Model by Quartile of Visceral Adiposity
Adjustment for all covariates in the final discrete-time Cox model (Model 3 in Table 2). Interquartile comparisons were significant with p < 0.01 except for quartile 1 versus quartile 2 (p = 0.30). Number at risk is listed under the x-axis. MetS = metabolic syndrome.

Comment in

References

    1. Bays HE. Adiposopathy: is “sick fat” a cardiovascular disease? J Am Coll Cardiol. 2011;57:2461–73. - PubMed
    1. Neeland IJ, Turer AT, Ayers CR, et al. Dysfunctional adiposity and the risk of prediabetes and type 2 diabetes in obese adults. JAMA. 2012;308:1150–9. - PMC - PubMed
    1. Liu J, Fox CS, Hickson D, Bidulescu A, Carr JJ, Taylor HA. Fatty liver, abdominal visceral fat, and cardiometabolic risk factors: the Jackson Heart Study. Arterioscler Thromb Vasc Biol. 2011;31:2715–22. - PMC - PubMed
    1. Britton KA, Massaro JM, Murabito JM, Kreger BE, Hoffmann U, Fox CS. Body fat distribution, incident cardiovascular disease, cancer, and all-cause mortality. J Am Coll Cardiol. 2013;62:921–5. - PMC - PubMed
    1. Hayashi T, Boyko EJ, Leonetti DL, et al. Visceral adiposity and the risk of impaired glucose tolerance: a prospective study among Japanese Americans. Diabetes Care. 2003;26:650–5. - PubMed

Publication types

MeSH terms