. 2014 Dec 2:7:532.
doi: 10.1186/s13071-014-0532-4.

Recent and projected future climatic suitability of North America for the Asian tiger mosquito Aedes albopictus

Affiliations

Recent and projected future climatic suitability of North America for the Asian tiger mosquito Aedes albopictus

Nicholas H Ogden et al. Parasit Vectors. .

Abstract

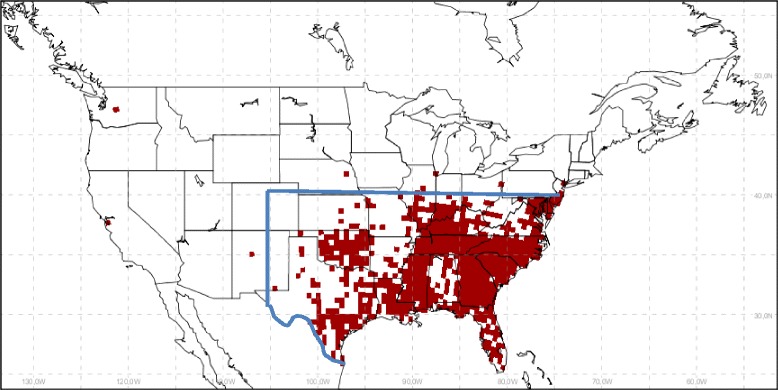
Background: Since the 1980s, populations of the Asian tiger mosquito Aedes albopictus have become established in south-eastern, eastern and central United States, extending to approximately 40°N. Ae. albopictus is a vector of a wide range of human pathogens including dengue and chikungunya viruses, which are currently emerging in the Caribbean and Central America and posing a threat to North America.

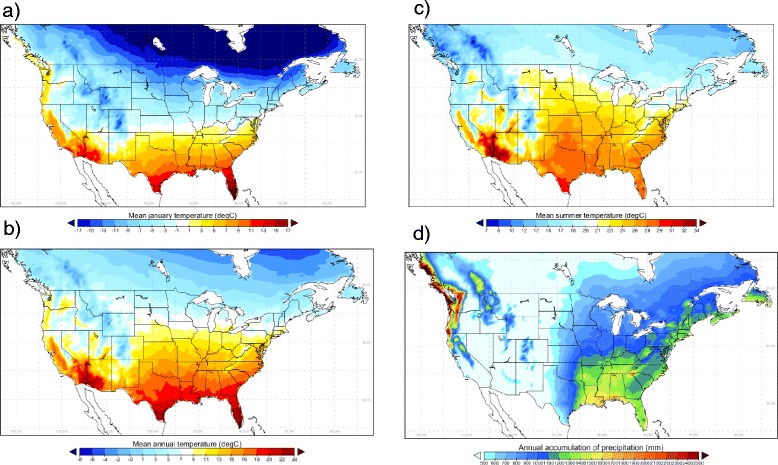
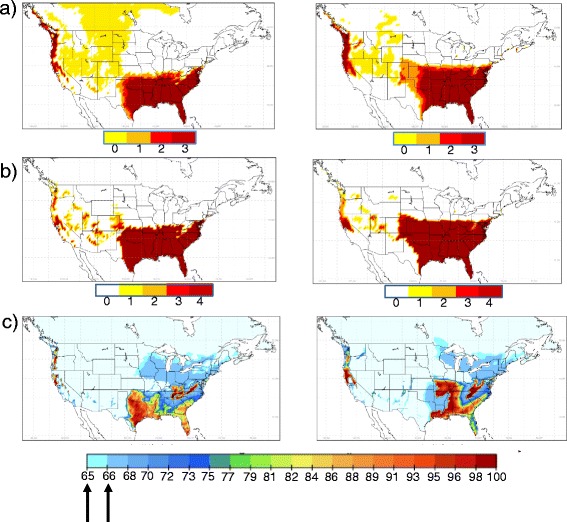
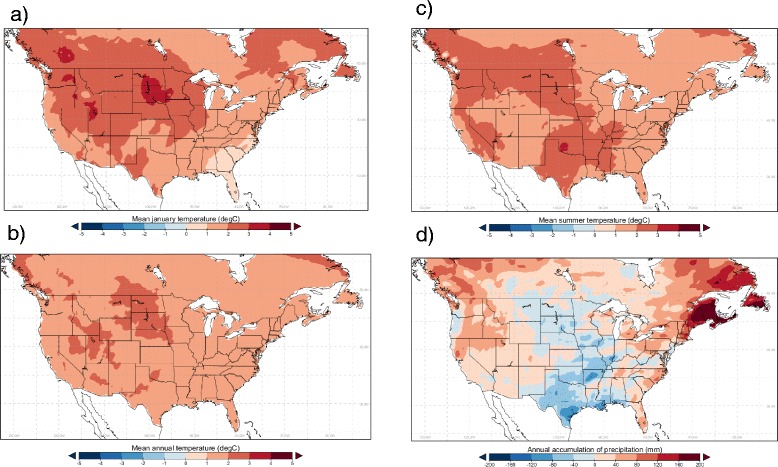
Methods: The risk of Ae. albopictus expanding its geographic range in North America under current and future climate was assessed using three climatic indicators of Ae. albopictus survival: overwintering conditions (OW), OW combined with annual air temperature (OWAT), and a linear index of precipitation and air temperature suitability expressed through a sigmoidal function (SIG). The capacity of these indicators to predict Ae. albopictus occurrence was evaluated using surveillance data from the United States. Projected future climatic suitability for Ae. albopictus was obtained using output of nine Regional Climate Model experiments (RCMs).

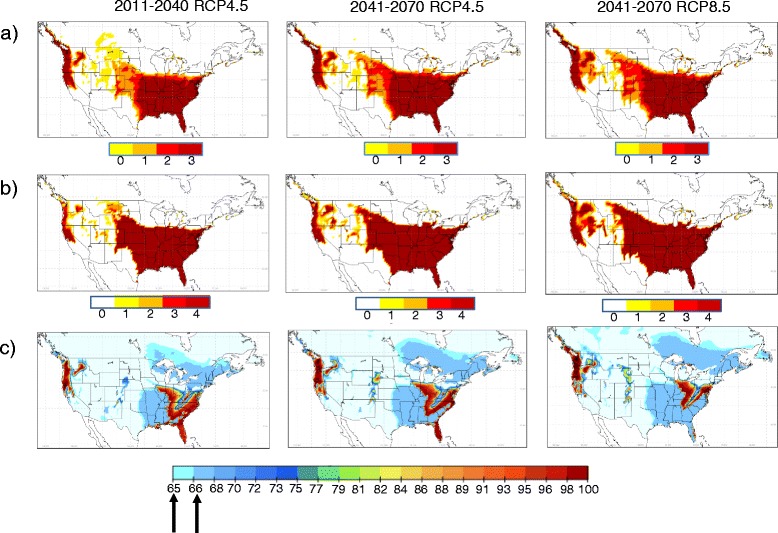
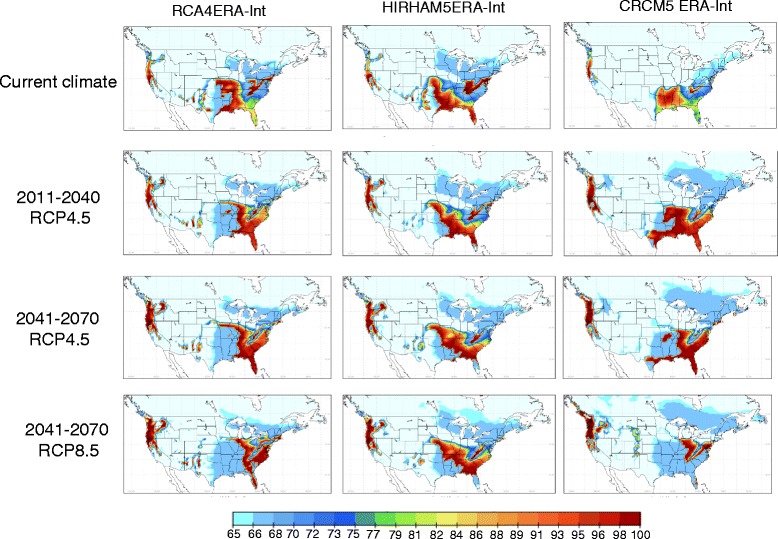
Results: OW and OWAT showed >90% specificity and sensitivity in predicting observed Ae. albopictus occurrence and also predicted moderate to high risk of Ae. albopictus invasion in Pacific coastal areas of the Unites States and Canada under current climate. SIG also well predicted observed Ae. albopictus occurrence (ROC area under the curve was 0.92) but predicted wider current climatic suitability in the north-central and north-eastern United States and south-eastern Canada. RCM output projected modest (circa 500 km) future northward range expansion of Ae. albopictus by the 2050s when using OW and OWAT indicators, but greater (600-1000 km) range expansion, particularly in eastern and central Canada, when using the SIG indicator. Variation in future possible distributions of Ae. albopictus was greater amongst the climatic indicators used than amongst the RCM experiments.

Conclusions: Current Ae. albopictus distributions were well predicted by simple climatic indicators and northward range expansion was predicted for the future with climate change. However, current and future predicted geographic distributions of Ae. albopictus varied amongst the climatic indicators used. Further field studies are needed to assess which climatic indicator is the most accurate in predicting regions suitable for Ae. albopictus survival in North America.


Figures

Figure 1
Figure 1
Surveillance data used in validation of the indicators. Distribution of Ae. albopictus populations in the United States, by county, according to surveillance data compiled by CDC, following transformation into the common 0.44 degrees square grid used in this study. The blue line indicates the data from south of 40°N and east of 105°W used in one of the Receiver Operator Characteristic evaluations of the performance of climatic indicators as described in the Methods section.
Figure 2
Figure 2
Current climate data. Long-term mean values for the period 1981–2010 of a) mean January temperature; b) mean annual temperature; c) mean summer (June, July and August) temperature; and d) cumulative annual precipitation for Canada and the United States. Results were obtained from daily time series of temperature and precipitation in the United States and Canada combined into the ANUSPLIN-CONUSL13 dataset and interpolated onto the common 0.44 degrees square grid used in this study.
Figure 3
Figure 3
Predictions of current climate suitability for Ae. albopictus. Maps of climatic suitability for Ae. albopictus using OW, OWAT and SIG (respectively maps a, b, and c) using observed climate data (1981–2010: left hand column) and CanRCM4 model output for a similar time period (1989–2010; right hand column). The colour scale below each map shows the value for each indicator, and for SIG the cut off at 66.69% and 64.64% is indicated by arrows. For the OW maps, climate of low suitability for Ae. albopictus is indicated by both yellow areas (where TJan is below 0°C and Pann is below 500 mm) and white areas (where both TJan is below 0°C or Pann is below 500 mm).
Figure 4
Figure 4
Projected climatic suitability for Ae. albopictus with climate change. Future climatic suitability for Ae. albopictus using OW, OWAT and SIG (respectively maps a, b, and c), projected using CanRCM4 model output as an illustration. The colour scale below each map shows the value for each indicator, and for SIG the cut off at 66.69% and 64.64% is indicated by arrows. The left hand column shows projections for 2011–2040 and the middle and right hand columns shows projections for 2041–2070 using, respectively, emissions scenarios provided by Representative Concentration Pathways RCP4.5 and RCP8.5. For the OW maps, climate of low suitability for Ae. albopictus is indicated by both yellow areas (where TJan is below 0°C and Pann is below 500 mm) and white areas (where either TJan is below 0°C or Pann is below 500 mm).
Figure 5
Figure 5
Projected changes in climate. An example of projected changes in temperature (panel a: average minimum for January; panel b: mean annual temperature; panel c: mean summer temperature) and precipitation (panel d: cumulative annual precipitation) data for Canada and the United States for 2011–2040 relative to 1981–2000 using output from the model CRCM4.2.3.
Figure 6
Figure 6
Variation in climate model output. An illustration of variation in current (1981–2010) and future (2011–2040 and 2041–2070) projected climatic suitability (using SIG) for Ae. albopictus using output from three climate models (from left to right hand columns: RCA4, HIRHAM5 and CRCM5). Projections for the time period 2041–2070 using emissions under both RCP4.5 and RCP8.5 are shown. The colour scale below each map shows the value SIG with the cut off at 66.69% and 64.64% indicated by arrows.

References

    1. Gratz NG. Critical review of the vector status of Aedes albopictus. Med Vet Entomol. 2004;18:215–227. doi: 10.1111/j.0269-283X.2004.00513.x. - DOI - PubMed
    1. European Environment Agency . ᅟ. ᅟ. The impacts of invasive alien species in Europe, technical report No 16/2012.
    1. Lowe S, Browne M, Boudjelas S, De Poorter M. ᅟ. ᅟ: Published by The Invasive Species Specialist Group (ISSG) a specialist group of the Species Survival Commission (SSC) of the World Conservation Union (IUCN); ᅟ. 100 of the World’s worst invasive alien species. A selection from the global invasive species database.
    1. European Centre for Disease Prevention and Control . ᅟ. ᅟ. Aedes albopictus.
    1. Leisnham PT, Towler L, Juliano SA. Geographic variation of photoperiodic diapause but not adult survival or reproduction of the invasive mosquito Aedes albopictus (Diptera: Culicidae) in North America. Ann Entomol Soc Am. 2011;104:1309–1318. doi: 10.1603/AN11032. - DOI - PMC - PubMed

Publication types