

High resolution surface plasmon resonance imaging for single cells
- PMID: 25441447
- PMCID: PMC4289309
- DOI: 10.1186/1471-2121-15-35
High resolution surface plasmon resonance imaging for single cells
Abstract
Background: Surface plasmon resonance imaging (SPRI) is a label-free technique that can image refractive index changes at an interface. We have previously used SPRI to study the dynamics of cell-substratum interactions. However, characterization of spatial resolution in 3 dimensions is necessary to quantitatively interpret SPR images. Spatial resolution is complicated by the asymmetric propagation length of surface plasmons in the x and y dimensions leading to image degradation in one direction. Inferring the distance of intracellular organelles and other subcellular features from the interface by SPRI is complicated by uncertainties regarding the detection of the evanescent wave decay into cells. This study provides an experimental basis for characterizing the resolution of an SPR imaging system in the lateral and distal dimensions and demonstrates a novel approach for resolving sub-micrometer cellular structures by SPRI. The SPRI resolution here is distinct in its ability to visualize subcellular structures that are in proximity to a surface, which is comparable with that of total internal reflection fluorescence (TIRF) microscopy but has the advantage of no fluorescent labels.
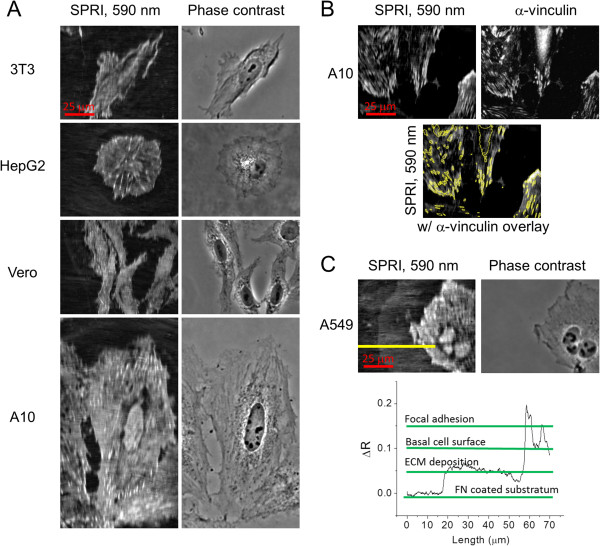
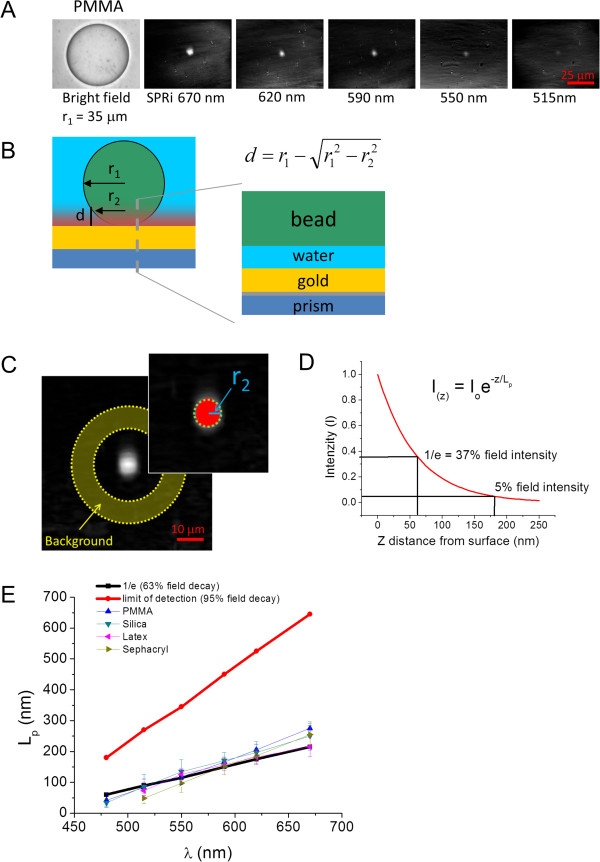
Results: An SPR imaging system was designed that uses a high numerical aperture objective lens to image cells and a digital light projector to pattern the angle of the incident excitation on the sample. Cellular components such as focal adhesions, nucleus, and cellular secretions are visualized. The point spread function of polymeric nanoparticle beads indicates near-diffraction limited spatial resolution. To characterize the z-axis response, we used micrometer scale polymeric beads with a refractive index similar to cells as reference materials to determine the detection limit of the SPR field as a function of distance from the substrate. Multi-wavelength measurements of these microspheres show that it is possible to tailor the effective depth of penetration of the evanescent wave into the cellular environment.
Conclusion: We describe how the use of patterned incident light provides SPRI at high spatial resolution, and we characterize a finite limit of detection for penetration depth. We demonstrate the application of a novel technique that allows unprecedented subcellular detail for SPRI, and enables a quantitative interpretation of SPRI for subcellular imaging.
Figures


Similar articles
-
Two-Dimensional Surface Plasmon Resonance Imaging System for Cellular Analysis.Methods Mol Biol. 2017;1571:31-46. doi: 10.1007/978-1-4939-6848-0_3. Methods Mol Biol. 2017. PMID: 28281248
-
Nanoplasmonics-enhanced label-free imaging of endothelial cell monolayer integrity.Biosens Bioelectron. 2019 Sep 15;141:111478. doi: 10.1016/j.bios.2019.111478. Epub 2019 Jun 25. Biosens Bioelectron. 2019. PMID: 31280004
-
Surface Plasmon Resonance Biosensors: A Review of Molecular Imaging with High Spatial Resolution.Biosensors (Basel). 2024 Feb 2;14(2):84. doi: 10.3390/bios14020084. Biosensors (Basel). 2024. PMID: 38392003 Free PMC article. Review.
-
Minimization of detection volume by surface-plasmon-coupled emission.Anal Biochem. 2006 Sep 1;356(1):125-31. doi: 10.1016/j.ab.2006.05.007. Epub 2006 May 24. Anal Biochem. 2006. PMID: 16764813
-
Imaging transmitter release. II. A practical guide to evanescent-wave imaging.Lasers Med Sci. 2001;16(3):159-70. doi: 10.1007/pl00011350. Lasers Med Sci. 2001. PMID: 11482813 Review.
Cited by
-
Trends in SPR Cytometry: Advances in Label-Free Detection of Cell Parameters.Biosensors (Basel). 2018 Oct 30;8(4):102. doi: 10.3390/bios8040102. Biosensors (Basel). 2018. PMID: 30380705 Free PMC article. Review.
-
A Localized Surface Plasmon Resonance Sensor Using Double-Metal-Complex Nanostructures and a Review of Recent Approaches.Sensors (Basel). 2017 Dec 31;18(1):98. doi: 10.3390/s18010098. Sensors (Basel). 2017. PMID: 29301238 Free PMC article. Review.
-
Development of SPR Imaging-Impedance Sensor for Multi-Parametric Living Cell Analysis.Sensors (Basel). 2019 May 3;19(9):2067. doi: 10.3390/s19092067. Sensors (Basel). 2019. PMID: 31058824 Free PMC article.
-
Sensitivity Analysis of Single- and Bimetallic Surface Plasmon Resonance Biosensors.Sensors (Basel). 2021 Jun 25;21(13):4348. doi: 10.3390/s21134348. Sensors (Basel). 2021. PMID: 34202104 Free PMC article.
-
Live nanoscopic to mesoscopic topography reconstruction with an optical microscope for chemical and biological samples.PLoS One. 2018 Dec 12;13(12):e0207881. doi: 10.1371/journal.pone.0207881. eCollection 2018. PLoS One. 2018. PMID: 30540777 Free PMC article.
References
MeSH terms
LinkOut - more resources
Full Text Sources
Other Literature Sources
