Review
. 2014 Nov;24(4):655-69.
doi: 10.1016/j.nic.2014.07.009. Epub 2014 Sep 6.

Resting-state blood oxygen level-dependent functional magnetic resonance imaging for presurgical planning

Affiliations
Review

Resting-state blood oxygen level-dependent functional magnetic resonance imaging for presurgical planning

Mudassar Kamran et al. Neuroimaging Clin N Am. 2014 Nov.

Abstract

Resting-state functional MR imaging (rsfMR imaging) measures spontaneous fluctuations in the blood oxygen level-dependent (BOLD) signal and can be used to elucidate the brain's functional organization. It is used to simultaneously assess multiple distributed resting-state networks. Unlike task-based functional MR imaging, rsfMR imaging does not require task performance. This article presents a brief introduction of rsfMR imaging processing methods followed by a detailed discussion on the use of rsfMR imaging in presurgical planning. Example cases are provided to highlight the strengths and limitations of the technique.

Keywords: Eloquent cortex; Functional MR imaging; MLP; Multilayered perceptron; RSNs; Resting-state functional MR imaging; Resting-state networks; rsfMR imaging.


Figures

Figure 1
Figure 1
Surface plots of RSNs as derived from fuzzy c-means algorithm [32]. A: Default mode network. B: Somatomotor network. C: Visual network. D: Language network. E: Dorsal attention network. F: ventral attention network. G: Frontoparietal control network. Image from [32] used with permission.
Figure 2
Figure 2
Single subject, voxel estimation of RSNs using the trained MLP in three subjects. The results are from the best, median, and worst performers as determined by root mean square classification error. MLP output was converted to a percentile scale and sampled onto each subject’s cortical surface. Image from [42] used with permission.
Figure 3
Figure 3
Comparison of resting state and task-related fMRI mapping in a 45 year old with a diagnosis of Glioblastoma (Case 1). A: Finger-tapping fMRI × 2. Activity within the tumor (blue arrows) was seen in trial 2 but not in trial 1. B: Resting state correlation mapping × 2 shows a similar distribution of correlated activity, resembling the activation from trial 1 but not trial 2. Image from [67] used with permission.
Figure 4
Figure 4
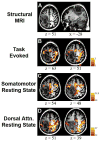
MRI of a 64-year-old man who presented with focal motor seizures (Case 2). A: Structural MRI revealed a tumor in left parietal cortex that invades territory near the central sulcus (neurologic convention). The green circle represents the location of ipsilateral hand response to cortical stimulation. B: Task-related activity was seen bilaterally in frontal lobe. In addition, a large band of activity appeared in right parietal cortex, not consistent with the pattern of activity from the sensorimotor network. C: Resting state correlation mapping using a seed in the right (unaffected) hemisphere (blue circle) showed ipsilateral correlations anterior to the tumor as well as a region of activity in midline parietal cortex. Note absence in the correlation mapping results of parietal activity seen in the task-related map. D: Parietal activation seen during task-evoked scan is revealed to be a separate resting state network, the dorsal attention network that is normally dissociated from the sensorimotor network (seed: blue circle). Image from [67] used with permission.
Figure 5
Figure 5
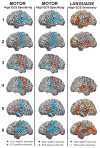
Comparison of ECS and MLP result for the motor and language cortex in six epilepsy patients. Colored triangles are ECS positive and Black circles are ECS negative. In the left column, the high ECS sensitivity method was employed to classify motor electrodes as ECS positive (red triangles) and compared to the MLP results (light blue). In the middle column, the high ECS specificity method was employed to classify motor electrodes. In the right column, the high ECS sensitive method was used to classify language electrodes as ECS positive (green triangles), with the MLP results displayed in orange. Image from [70] used with permission.
Figure 6
Figure 6
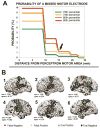
The method employed to define a “no-cut” area in epilepsy patients, in which the probability of damage to motor cortex is substantial. A: To define the area, several multilayer perceptron (MLP) thresholds (70, 75, 80, 85 percentiles) were used to classify electrodes as covering motor cortex, and the “no-cut” zone was expanded around each of the motor electrodes. The probability of a missed motor electrode, which could result in motor deficits, was plotted against the radius of expansion. B: A visualization of the method performed at the 85% and at a radius of expansion of 15 mm. Red triangles mark motor cortex as determined by ECS that were missed by the MLP method. Image from [70] used with permission.
Figure 7
Figure 7
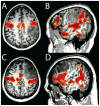
Examples of RSN (in red) superposed on T1-weighted images in two case examples. The somatomotor (A) and language (B) RSNs are shown for case example 1 (2.5.1). Similarly, the somatomotor (C) and language (D) RSNs are shown for case example 2 (2.5.2). See text for more detail.

References

    1. Posner MI, Raichle ME. Images of mind. New York: Scientific American Library: Distributed by W.H. Freeman and Co; 1997.
    1. Spitzer M, Kwong KK, Kennedy W, Rosen BR, Belliveau JW. Category-specific brain activation in fMRI during picture naming. Neuroreport. 1995 Nov;6(16):2109–2112. - PubMed
    1. Clarke DD, Sokoloff L. [Accessed: 08-Apr-2014];Circulation and Energy Metabolism of the Brain. 1999 [Online]. Available: http://www.ncbi.nlm.nih.gov/books/NBK20413/
    1. Raichle ME, Mintun MA. Brain Work and Brain Imaging. Annu Rev Neurosci. 2006;29(1):449–476. - PubMed
    1. Shulman RG, Rothman DL, Behar KL, Hyder F. Energetic basis of brain activity: implications for neuroimaging. Trends Neurosci. 2004 Aug;27(8):489–495. - PubMed

Publication types