. 2014 Dec 1;15(1):1045.
doi: 10.1186/1471-2164-15-1045.

Transcriptome structure variability in Saccharomyces cerevisiae strains determined with a newly developed assembly software

Affiliations

Transcriptome structure variability in Saccharomyces cerevisiae strains determined with a newly developed assembly software

Alessandro Sardu et al. BMC Genomics. .

Abstract

Background: RNA-seq studies have an important role for both large-scale analysis of gene expression and for transcriptome reconstruction. However, the lack of software specifically developed for the analysis of the transcriptome structure in lower eukaryotes, has so far limited the comparative studies among different species and strains.

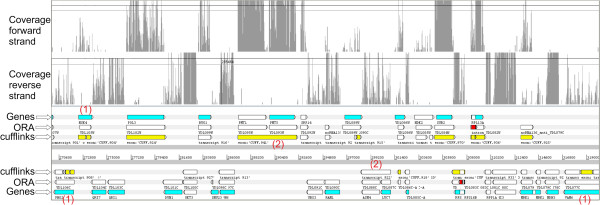
Results: In order to fill this gap, an innovative software called ORA (Overlapped Reads Assembler) was developed. This software allows a simple and reliable analysis of the transcriptome structure in organisms with a low number of introns. It can also determine the size and the position of the untranslated regions (UTR) and of polycistronic transcripts. As a case study, we analyzed the transcriptional landscape of six S. cerevisiae strains in two different key steps of the fermentation process. This comparative analysis revealed differences in the UTR regions of transcripts. By extending the transcriptome analysis to yeast species belonging to the Saccharomyces genus, it was possible to examine the conservation level of unknown non-coding RNAs and their putative functional role.

Conclusions: By comparing the results obtained using ORA with previous studies and with the transcriptome structure determined with other software, it was proven that ORA has a remarkable reliability. The results obtained from the training set made it possible to detect the presence of transcripts with variable UTRs between S. cerevisiae strains. Finally, we propose a regulatory role for some non-coding transcripts conserved within the Saccharomyces genus and localized in the antisense strand to genes involved in meiosis and cell wall biosynthesis.


Figures

Figure 1
Figure 1
Schematic representation of the transcriptome assembly process performed by ORA. The circle indicates the gaps located between reference-based blocks.
Figure 2
Figure 2
Comparison between UTR sizes predicted using different methods. (a) Comparison between the 5’-UTR size predicted by ORA and 5’-RACE in the S288c strain. Positive values indicate transcripts with larger 5’-UTR size in the prediction obtained with ORA. (b) Comparison between the 3’-UTR size obtained with ORA and the tiling arrays (S288c strain). Positive values indicate transcripts with larger 3’-UTRs in the prediction obtained using ORA. Note the slight underestimation of the 3’-UTR size obtained using ORA. (c) Histogram reporting the difference between the length of the 5’-UTR in S288c predicted by Cufflinks and by 5’-RACE. Positive values indicate a larger 5’-UTR determined by Cufflinks. Note the slight overestimation of the 5’-UTR size obtained using Cufflinks.
Figure 3
Figure 3
Transcripts predicted in a region of S. cerevisiae chr IV (strain S288c) comprised between ~270.600 bp and ~319,000 bp. From top to bottom: coverage on the forward strand, coverage on the reverse strand, genes (protein-encoding regions) (Genes), reconstruction of the transcripts obtained with ORA (ORA) and with Cufflinks (Cufflinks). In the row reporting the predictions of ORA, the introns are colored in red. Red numbers indicate key differences in transcript reconstruction between the two software: (1) transcripts formed by multiple “blocks” in the reconstruction with Cufflinks which are determined by the presence of gaps with no coverage in the coding region, (2) adjacent genes joined in polycistronic transcripts by Cufflinks despite large coverage differences.
Figure 4
Figure 4
Two examples of the transcript structure obtained in the reference strain S288c and vineyard strains EC1118 and P283. (a) Transcript reconstruction of the gene YBR249C (ARO4, 3-deoxy-D-arabino-heptulosonate-7-phosphate (DAHP) synthase) at 6 g/l. (b) The transcript of the gene YLR304C (ACO1; aconitase, required for the TCA cycle) at 45 g/l. The red and blue rods indicate the end of the UTR region and transcript, respectively. The y axis reports the coverage, while the x axis shows the relative position. In both examples, the genes are encoded in the reverse strand, and consequently the 5’-UTR is on the right part of the graph.
Figure 5
Figure 5
Coverage (a) and length (b) of six classes of transcripts identified by ORA in the S288c strain at 6 g/l. From left to right are reported: transcripts encoding proteins (prot. encod.), non-coding transcripts localized in antisense to other genes (mainly protein-encoding) (SAUT), non-coding transcripts localized in intergenic regions (SUT), tRNAs, other non-coding RNAs (mainly small nuclear RNAs) and ncRNAs localized in intronic regions. The number of transcripts identified for each class in the S288c strain at 6 g/l is shown in (a).
Figure 6
Figure 6
Coverage profiles on forward and reverse strands for six selected genes. Genes reported in figure belong to the GO categories “reproductive process in single-celled organism” (RRT12, SMA2, SPO77), “sporulation resulting in formation of a cellular spore” (IME4) and “fungal-type cell wall” (DSE2). SAUTs conserved in all the Saccharomyces species analyzed (indicated by red boxes) were found in all the genes except IME4 and DSE2. An inverse correlation in gene expression between the protein-encoding transcript and the SAUT is highlighted by red/green arrows and was previously demonstrated for IME4[15].

References

    1. Goffeau A, Barrell BG, Bussey H, Davis RW, Dujon B, Feldmann H, Galibert F, Hoheisel JD, Jacq C, Johnston M, Louis EJ, Mewes HW, Murakami Y, Philippsen P, Tettelin H, Oliver SG. Life with 6000 genes. Science. 1996;274(5287):546. doi: 10.1126/science.274.5287.546. - DOI - PubMed
    1. Yvert G, Brem RB, Whittle J, Akey JM, Foss E, Smith EN, Mackelprang R, Kruglyak L. Trans-acting regulatory variation in Saccharomyces cerevisiae and the role of transcription factors. Nat Genet. 2003;35(1):57–64. doi: 10.1038/ng1222. - DOI - PubMed
    1. Kvitek DJ, Will JL, Gasch AP. Variations in stress sensitivity and genomic expression in diverse S. cerevisiae isolates. PLoS Genet. 2008;4(10):e1000223. doi: 10.1371/journal.pgen.1000223. - DOI - PMC - PubMed
    1. Fay JC, McCullough HL, Sniegowski PD, Eisen MB. Population genetic variation in gene expression is associated with phenotypic variation in Saccharomyces cerevisiae. Genome Biol. 2004;5(4):R26. doi: 10.1186/gb-2004-5-4-r26. - DOI - PMC - PubMed
    1. Sung HM, Wang TY, Wang D, Huang YS, Wu JP, Tsai HK, Tzeng J, Huang CJ, Lee YC, Yang P, Hsu J, Chang T, Cho CY, Weng LC, Lee TC, Chang TH, Li WH, Shih MC. Roles of trans and cis variation in yeast intraspecies evolution of gene expression. Mol Biol Evol. 2009;26(11):2533–2538. doi: 10.1093/molbev/msp171. - DOI - PMC - PubMed

Publication types