Comparative Study
. 2015 Jan 2;48(1):153-61.
doi: 10.1016/j.jbiomech.2014.09.016. Epub 2014 Sep 28.

Quantitative computed tomography-based finite element analysis predictions of femoral strength and stiffness depend on computed tomography settings

Affiliations
Comparative Study

Quantitative computed tomography-based finite element analysis predictions of femoral strength and stiffness depend on computed tomography settings

Dan Dragomir-Daescu et al. J Biomech. .

Abstract

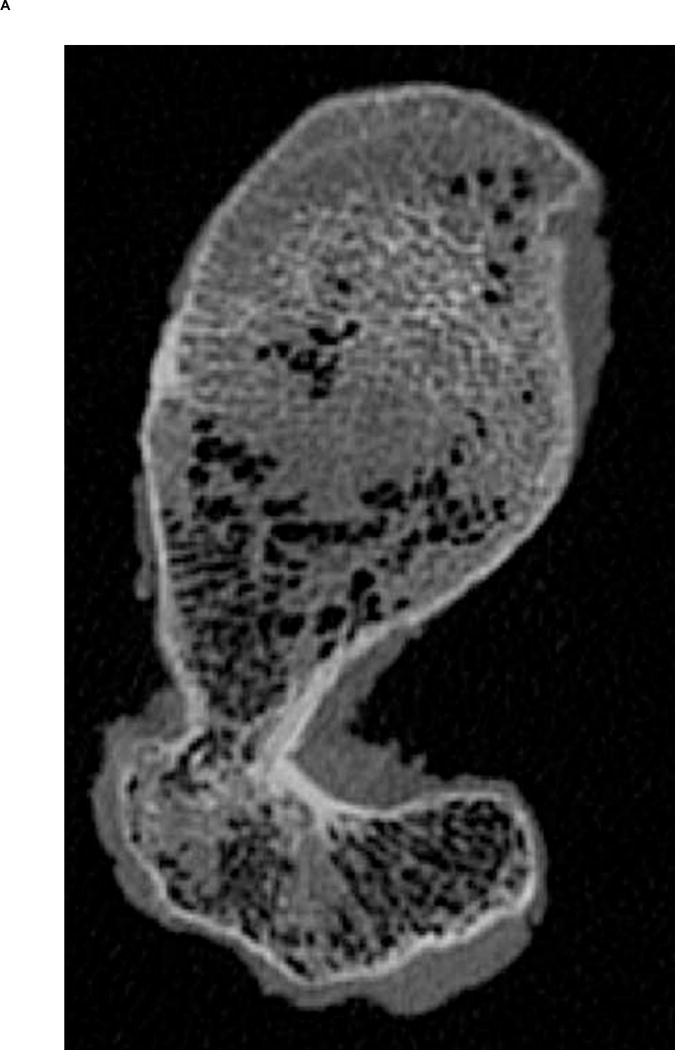
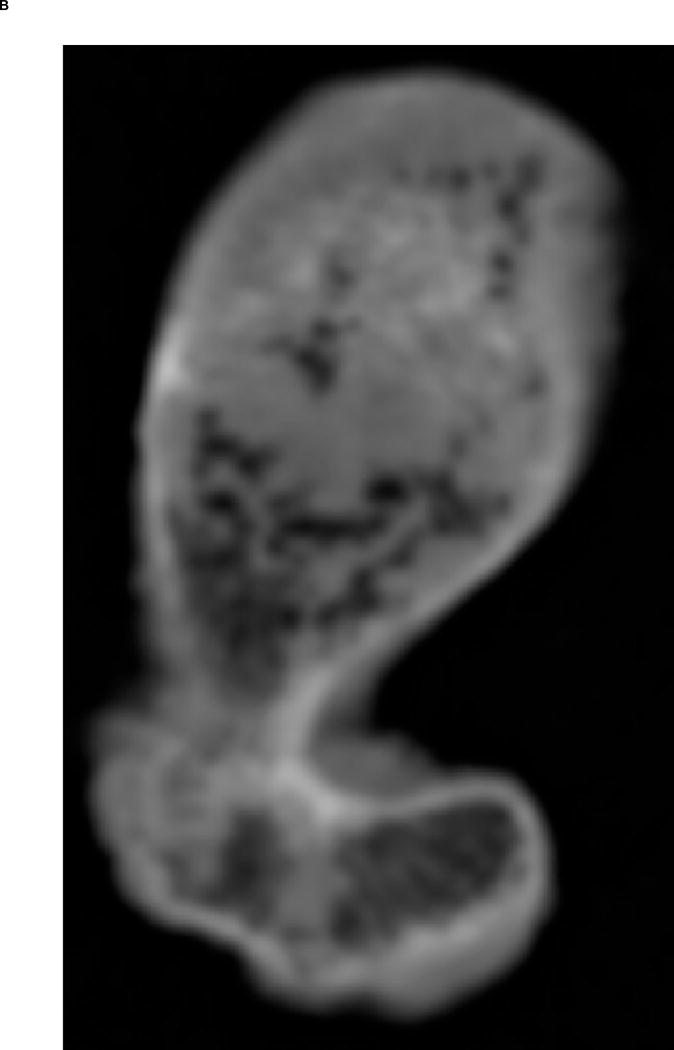
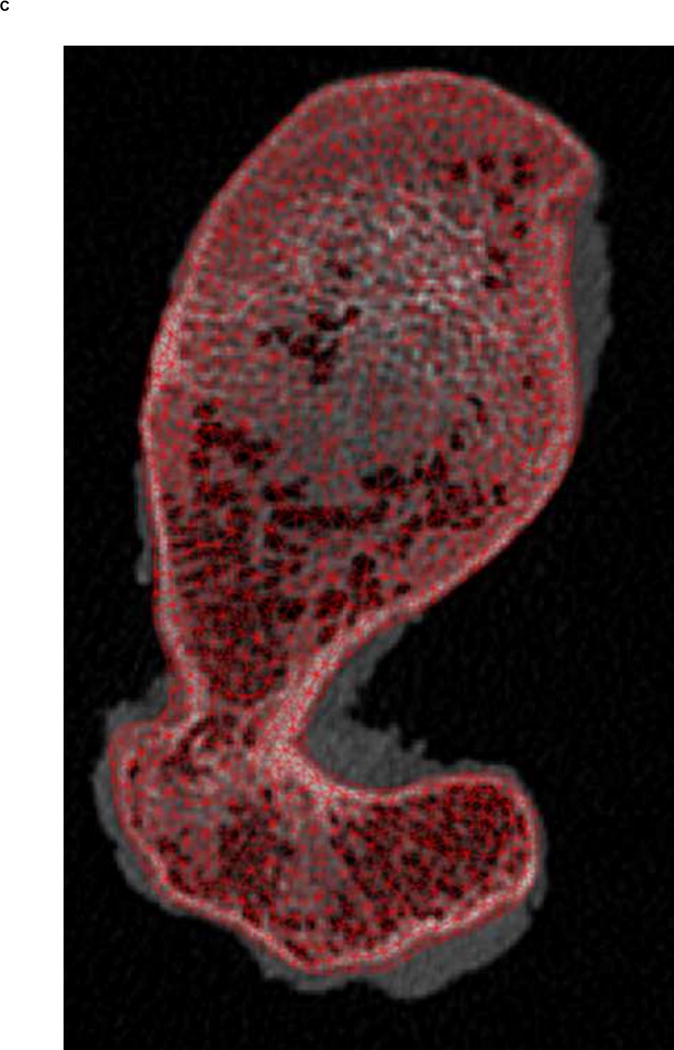
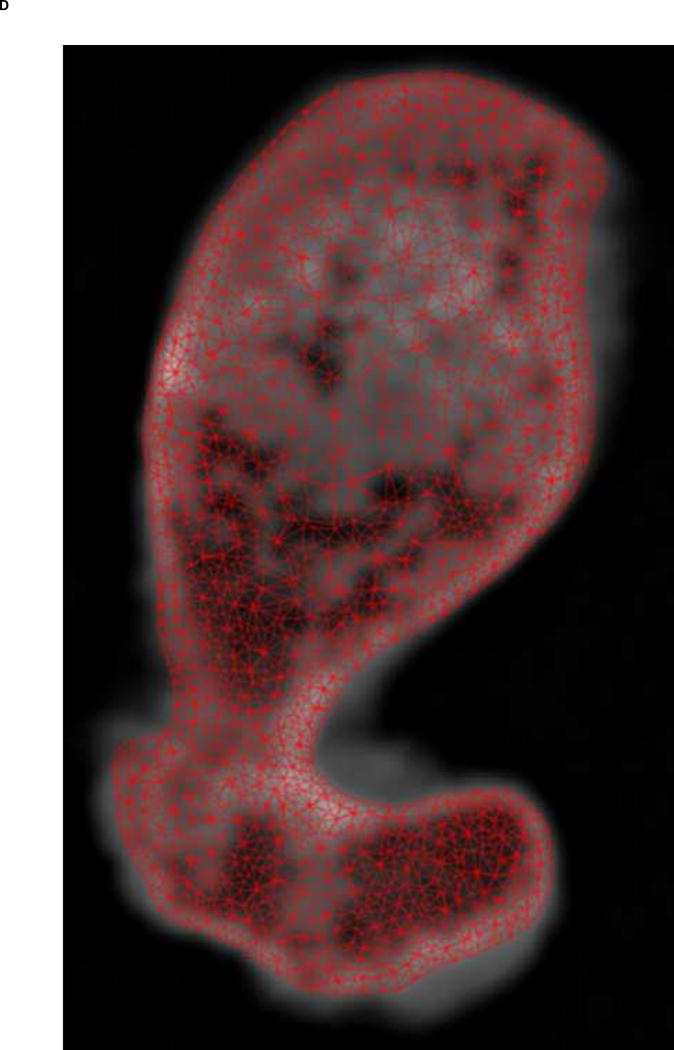
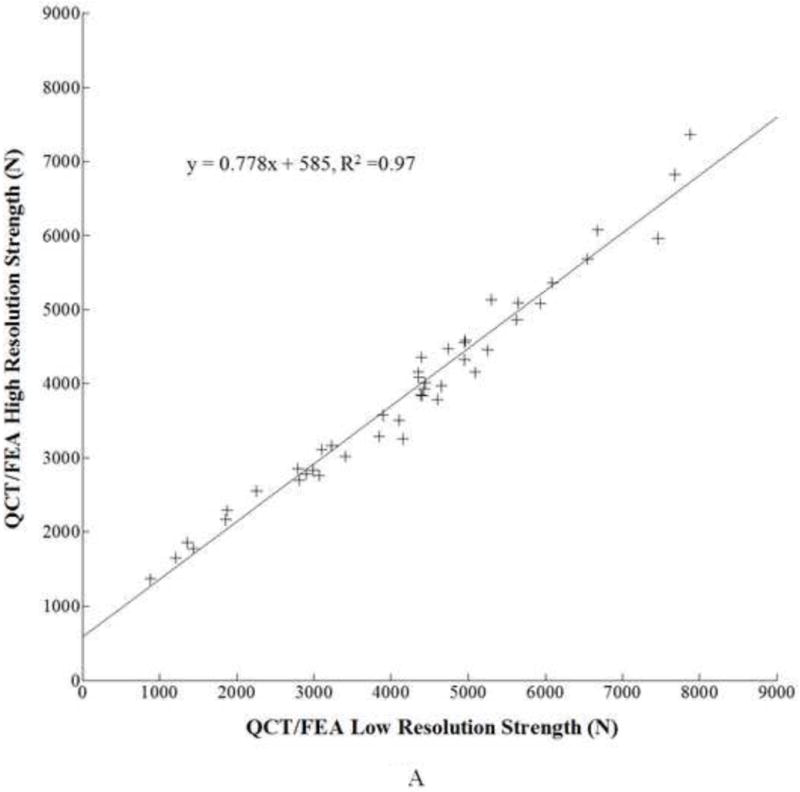
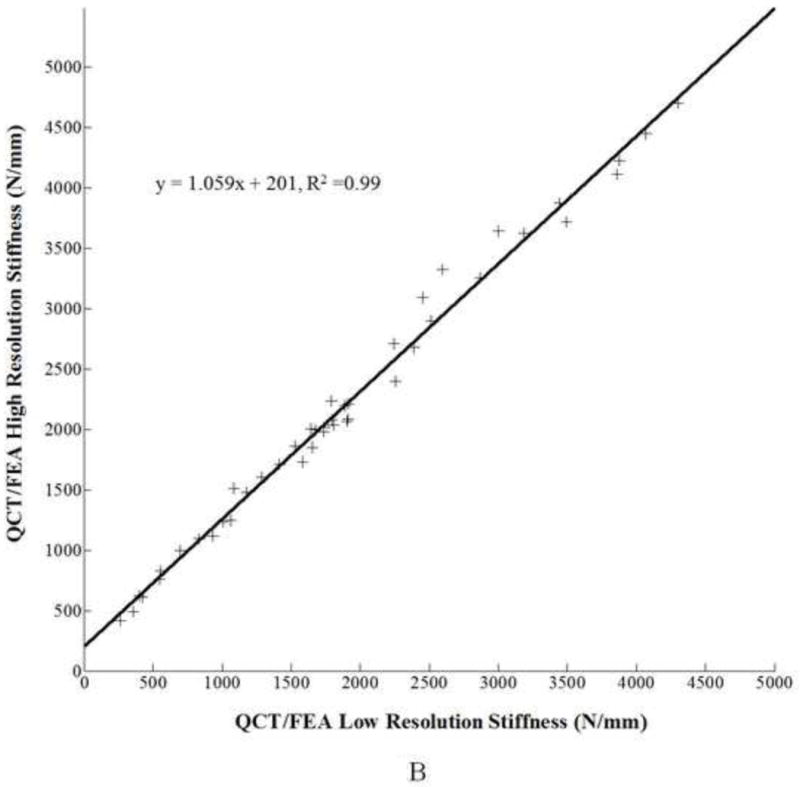
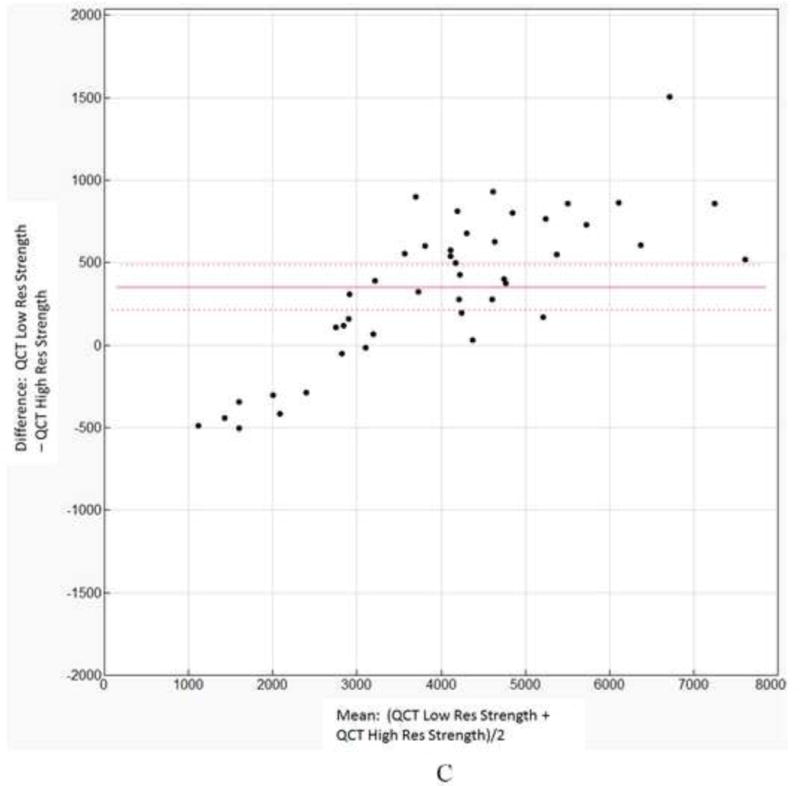
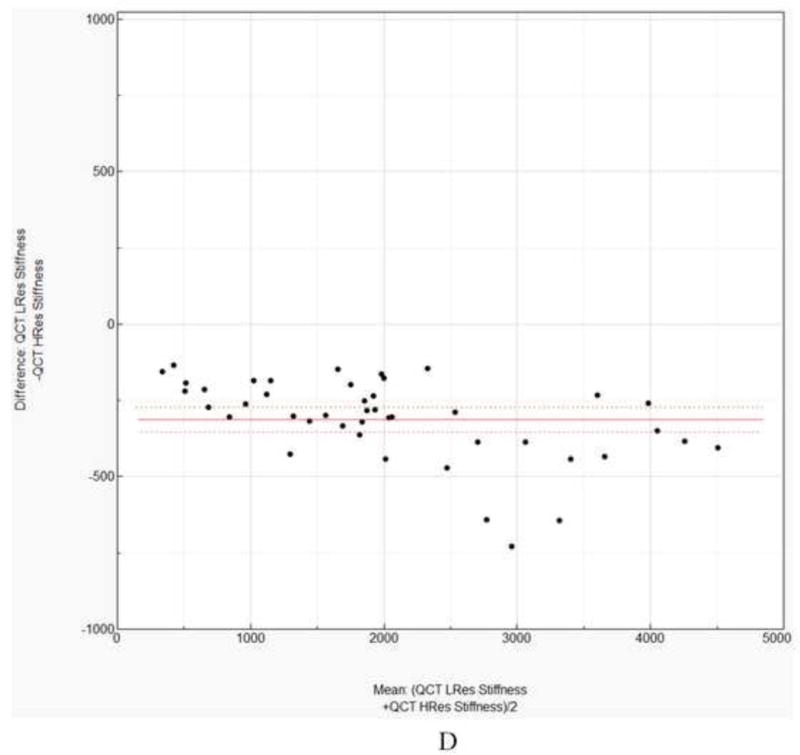
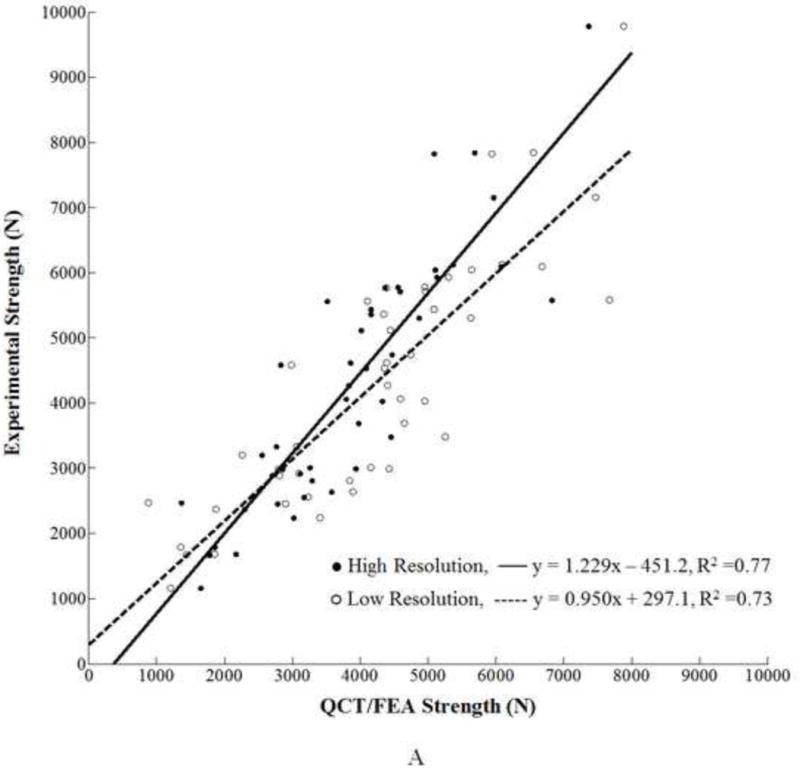
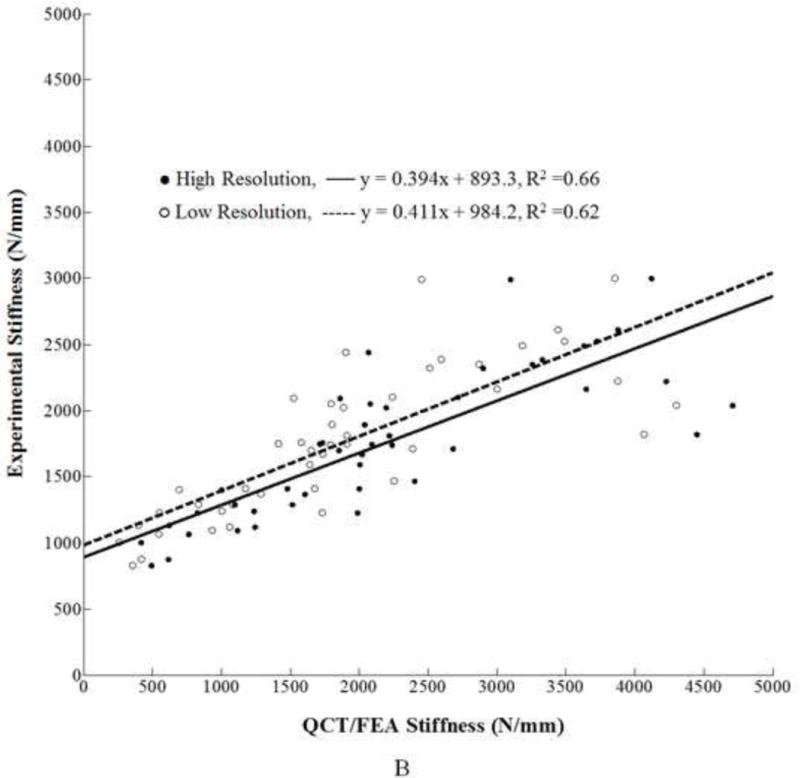
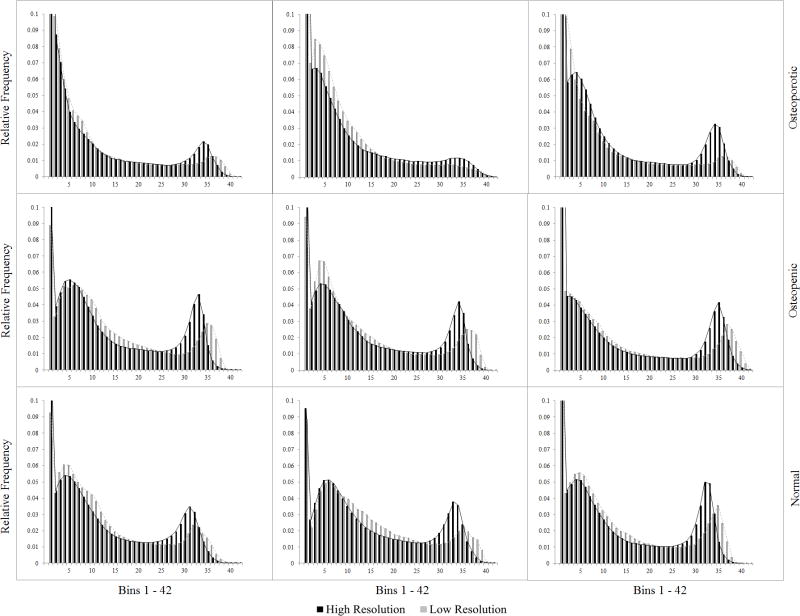
The aim of the present study was to compare proximal femur strength and stiffness obtained experimentally with estimations from Finite Element Analysis (FEA) models derived from Quantitative Computed Tomography (QCT) scans acquired at two different scanner settings. QCT/FEA models could potentially aid in diagnosis and treatment of osteoporosis but several drawbacks still limit their predictive ability. One potential reason is that the models are still sensitive to scanner settings which could lead to changes in assigned material properties, thus limiting their results accuracy and clinical effectiveness. To find the mechanical properties we fracture tested 44 proximal femora in a sideways fall-on-the-hip configuration. Before testing, we CT scanned all femora twice, first at high resolution scanner settings, and second at low resolution scanner settings and built 88 QCT/FEA models of femoral strength and stiffness. The femoral set neck bone mineral density, as measured by DXA, uniformly covered the range from osteoporotic to normal. This study showed that the femoral strength and stiffness values predicted from high and low resolution scans were significantly different (p<0.0001). Strength estimated from high resolution QCT scans was larger for osteoporotic, but smaller for normal and osteopenic femora when compared to low resolution scans. In addition, stiffness estimated from high resolution scans was consistently larger than stiffness obtained from low resolution scans over the entire femoral dataset. While QCT/FEA techniques hold promise for use in clinical settings we provided evidence that further improvements are required to increase robustness in their predictive power under different scanner settings and modeling assumptions.

Keywords: CT resolution; Femur fracture; Finite Element Analysis; Osteoporosis; Quantitative Computed Tomography.


Conflict of interest statement

Conflicts of Interest

The authors have no conflicts to disclose.

Figures

Figure 1
Figure 1
A. Transverse view of proximal femur metaphysis using high resolution QCT scanning settings. B. Transverse view of proximal femur metaphysis using low resolution QCT scanning setings. Low resolution image shows lower contrast than high resolution image. C. Transverse cross-section of high resolution QCT/FEA meshed model. D. Transverse cross-section of low resolution QCT/FEA meshed model.
Figure 1
Figure 1
A. Transverse view of proximal femur metaphysis using high resolution QCT scanning settings. B. Transverse view of proximal femur metaphysis using low resolution QCT scanning setings. Low resolution image shows lower contrast than high resolution image. C. Transverse cross-section of high resolution QCT/FEA meshed model. D. Transverse cross-section of low resolution QCT/FEA meshed model.
Figure 2
Figure 2
A. Linear regression for low resolution QCT/FEA estimated strength as a predictor of high resolution QCT/FEA estimated strength. B. Linear regression for low resolution QCT/FEA estimated stiffness as a predictor of high resolution QCT/FEA estimated stiffness. C. Bland Altman mean difference plot for strength. D. Bland Altman mean difference plot for stiffness.
Figure 2
Figure 2
A. Linear regression for low resolution QCT/FEA estimated strength as a predictor of high resolution QCT/FEA estimated strength. B. Linear regression for low resolution QCT/FEA estimated stiffness as a predictor of high resolution QCT/FEA estimated stiffness. C. Bland Altman mean difference plot for strength. D. Bland Altman mean difference plot for stiffness.
Figure 3
Figure 3
A. Linear regression for high and low resolution QCT/FEA estimated strength as predictors of experimental strength. B. Linear regression for high and low resolution QCT/FEA estimated stiffness as predictors of experimental stiffness.
Figure 3
Figure 3
A. Linear regression for high and low resolution QCT/FEA estimated strength as predictors of experimental strength. B. Linear regression for high and low resolution QCT/FEA estimated stiffness as predictors of experimental stiffness.
Figure 4
Figure 4
Normalized material modulus histograms for nine femora. (three osteoporotic, three osteopenic, three with normal bone mineral density)

Similar articles

Cited by

References

    1. Amin S, Kopperdhal DL, Melton LJ, 3rd, Achenbach SJ, Therneau TM, Riggs BL, Keaveny TM, Khosla S. Association of hip strength estimates by finite-element analysis with fractures in women and men. J Bone Miner Res. 2011 Jul;26(7):1593–600. - PMC - PubMed
    1. Bessho M, Ohnishi I, Matsuyama J, Matsumoto T, Imai K, Nakamura K. Prediction of strength and strain of the proximal femur by a CT-based finite element method. J Biomech. 2007;40:1745–53. - PubMed
    1. Bessho M, Ohnishi I, Matsumoto T, Ohashi S, Matsuyama J, Tobita K, et al. Predication of proximal femur strength using a CT-based nonlinear finite element method: Differences in predicated fracture load and site with changing load and boundary conditions. Bone. 2009;45:226–31. - PubMed
    1. Center JR, Nguyen TV, Schneider D, Sambrook PN, Eisman JA. Mortality after all major types of osteoporotic fracture in men and women: an observational study. Lancet. 1999 Mar 13;353(9156):878–82. - PubMed
    1. Cody DD, Gross GJ, Hou FJ, Spencer HJ, Goldstein SA, Fyhrie DP. Femoral strength is better predicted by finite element models than QCT and DXA. J Biomech. 1999 Oct;32(10):1013–20. - PubMed

Publication types