

De novo prediction of cis-regulatory elements and modules through integrative analysis of a large number of ChIP datasets
- PMID: 25442502
- PMCID: PMC4265420
- DOI: 10.1186/1471-2164-15-1047
De novo prediction of cis-regulatory elements and modules through integrative analysis of a large number of ChIP datasets
Abstract
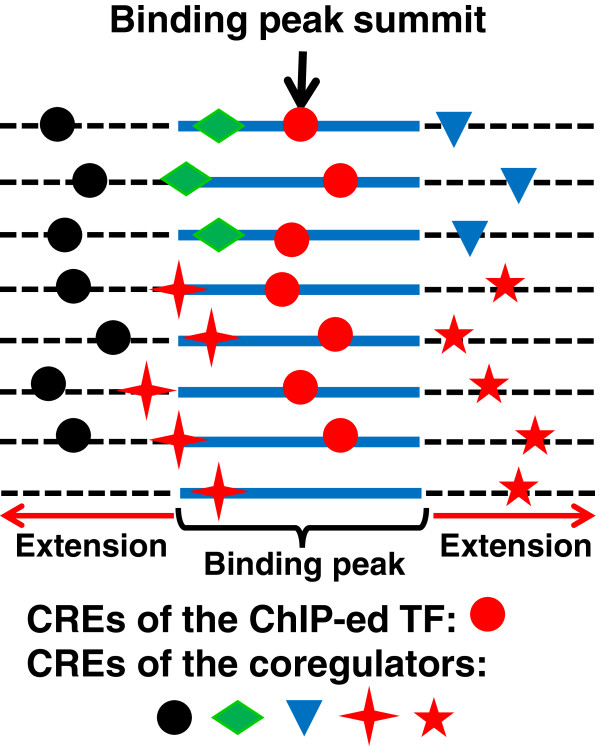
Background: In eukaryotes, transcriptional regulation is usually mediated by interactions of multiple transcription factors (TFs) with their respective specific cis-regulatory elements (CREs) in the so-called cis-regulatory modules (CRMs) in DNA. Although the knowledge of CREs and CRMs in a genome is crucial to elucidate gene regulatory networks and understand many important biological phenomena, little is known about the CREs and CRMs in most eukaryotic genomes due to the difficulty to characterize them by either computational or traditional experimental methods. However, the exponentially increasing number of TF binding location data produced by the recent wide adaptation of chromatin immunoprecipitation coupled with microarray hybridization (ChIP-chip) or high-throughput sequencing (ChIP-seq) technologies has provided an unprecedented opportunity to identify CRMs and CREs in genomes. Nonetheless, how to effectively mine these large volumes of ChIP data to identify CREs and CRMs at nucleotide resolution is a highly challenging task.
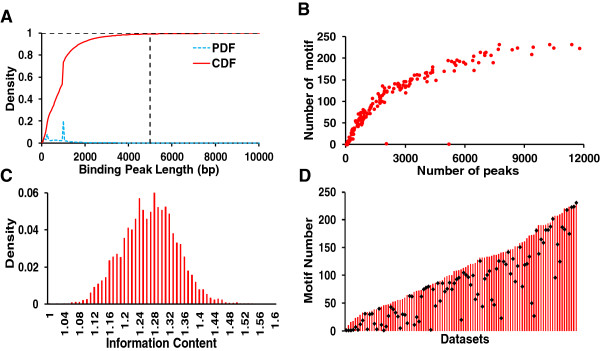
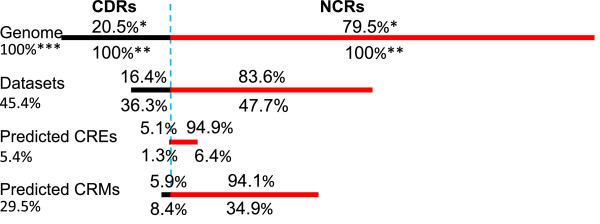
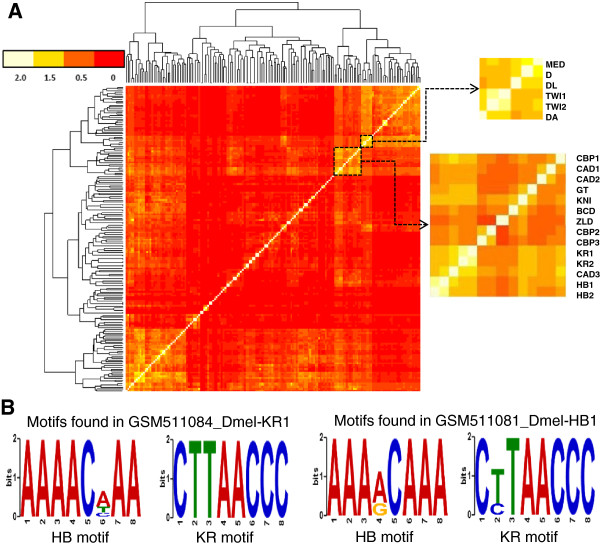
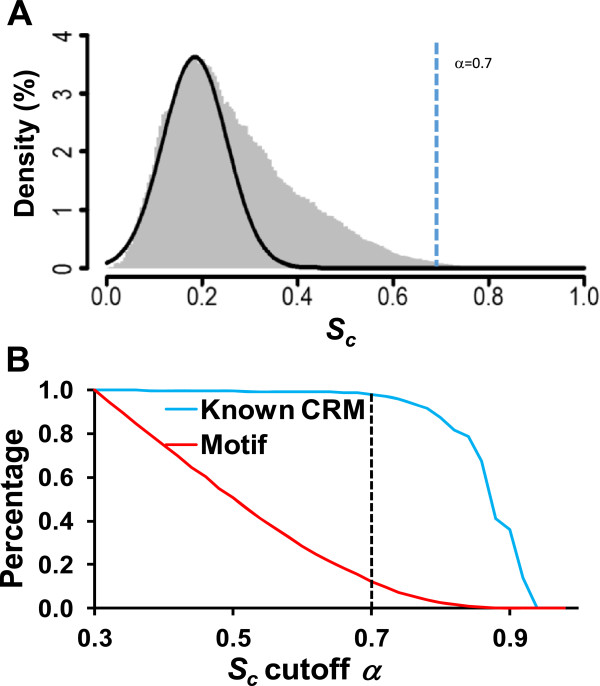
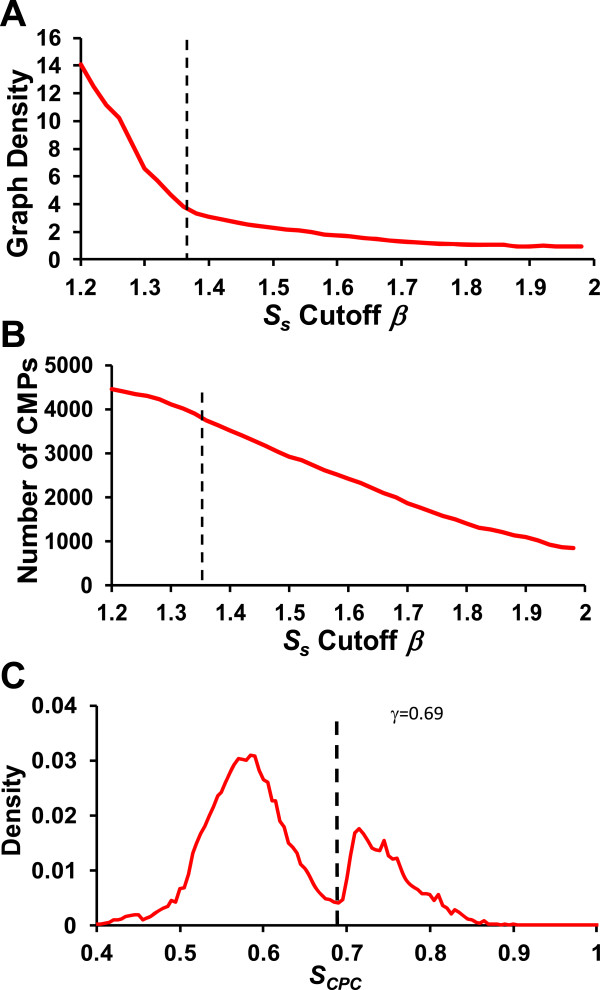
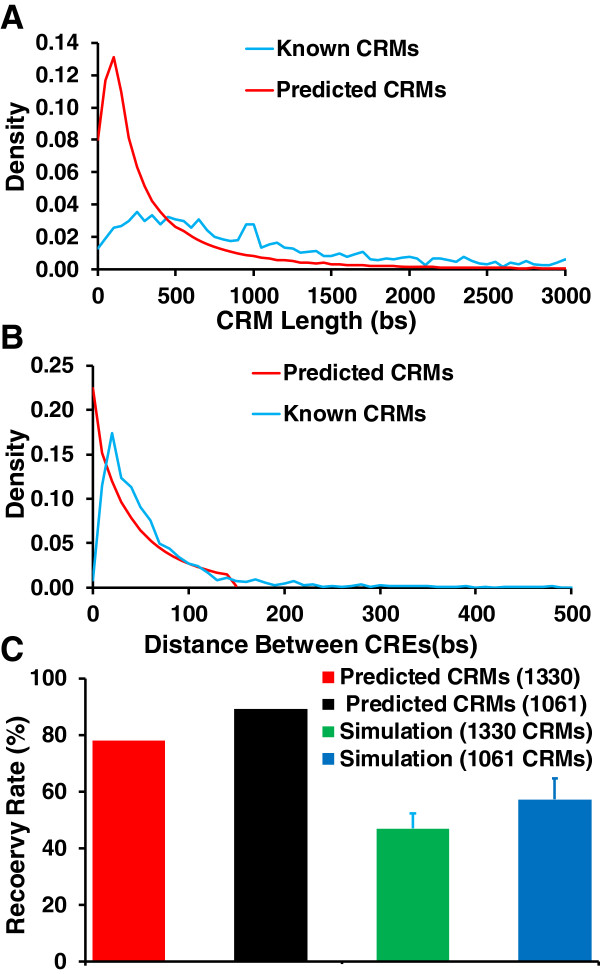
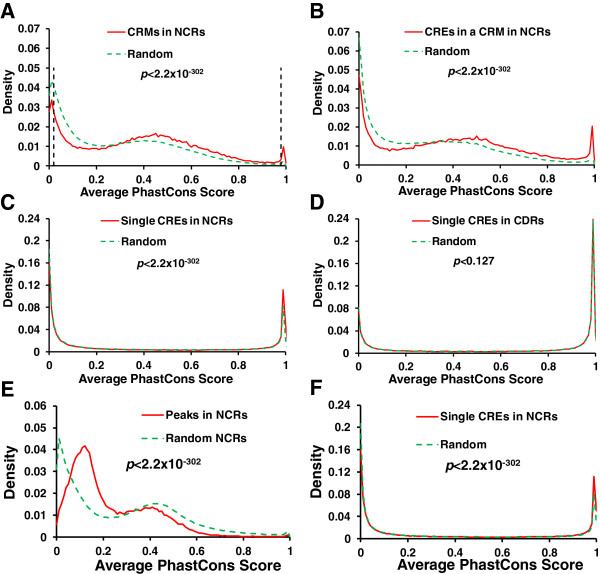
Results: We have developed a novel graph-theoretic based algorithm DePCRM for genome-wide de novo predictions of CREs and CRMs using a large number of ChIP datasets. DePCRM predicts CREs and CRMs by identifying overrepresented combinatorial CRE motif patterns in multiple ChIP datasets in an effective way. When applied to 168 ChIP datasets of 56 TFs from D. melanogaster, DePCRM identified 184 and 746 overrepresented CRE motifs and their combinatorial patterns, respectively, and predicted a total of 115,932 CRMs in the genome. The predictions recover 77.9% of known CRMs in the datasets and 89.3% of known CRMs containing at least one predicted CRE. We found that the putative CRMs as well as CREs as a whole in a CRM are more conserved than randomly selected sequences.
Conclusion: Our results suggest that the CRMs predicted by DePCRM are highly likely to be functional. Our algorithm is the first of its kind for de novo genome-wide prediction of CREs and CRMs using larger number of transcription factor ChIP datasets. The algorithm and predictions will hopefully facilitate the elucidation of gene regulatory networks in eukaryotes. All the predicted CREs, CRMs, and their target genes are available at http://bioinfo.uncc.edu/mniu/pcrms/www/.
Figures

Similar articles
-
Towards a map of cis-regulatory sequences in the human genome.Nucleic Acids Res. 2018 Jun 20;46(11):5395-5409. doi: 10.1093/nar/gky338. Nucleic Acids Res. 2018. PMID: 29733395 Free PMC article.
-
Identifying cis-regulatory modules by combining comparative and compositional analysis of DNA.Bioinformatics. 2006 Dec 1;22(23):2858-64. doi: 10.1093/bioinformatics/btl499. Epub 2006 Oct 10. Bioinformatics. 2006. PMID: 17032682
-
cisMEP: an integrated repository of genomic epigenetic profiles and cis-regulatory modules in Drosophila.BMC Syst Biol. 2014;8 Suppl 4(Suppl 4):S8. doi: 10.1186/1752-0509-8-S4-S8. Epub 2014 Dec 8. BMC Syst Biol. 2014. PMID: 25521507 Free PMC article.
-
Identifying transcriptional cis-regulatory modules in animal genomes.Wiley Interdiscip Rev Dev Biol. 2015 Mar-Apr;4(2):59-84. doi: 10.1002/wdev.168. Epub 2014 Dec 29. Wiley Interdiscip Rev Dev Biol. 2015. PMID: 25704908 Free PMC article. Review.
-
Organizing combinatorial transcription factor recruitment at cis-regulatory modules.Transcription. 2018;9(4):233-239. doi: 10.1080/21541264.2017.1394424. Epub 2017 Nov 28. Transcription. 2018. PMID: 29105538 Free PMC article. Review.
Cited by
-
Maps of context-dependent putative regulatory regions and genomic signal interactions.Nucleic Acids Res. 2016 Nov 2;44(19):9110-9120. doi: 10.1093/nar/gkw800. Epub 2016 Sep 12. Nucleic Acids Res. 2016. PMID: 27625394 Free PMC article.
-
Accurate prediction of cis-regulatory modules reveals a prevalent regulatory genome of humans.NAR Genom Bioinform. 2021 Jun 17;3(2):lqab052. doi: 10.1093/nargab/lqab052. eCollection 2021 Jun. NAR Genom Bioinform. 2021. PMID: 34159315 Free PMC article.
-
Towards a map of cis-regulatory sequences in the human genome.Nucleic Acids Res. 2018 Jun 20;46(11):5395-5409. doi: 10.1093/nar/gky338. Nucleic Acids Res. 2018. PMID: 29733395 Free PMC article.
-
Modeling the cis-regulatory modules of genes expressed in developmental stages of Drosophila melanogaster.PeerJ. 2017 May 30;5:e3389. doi: 10.7717/peerj.3389. eCollection 2017. PeerJ. 2017. PMID: 28584716 Free PMC article.
-
REDfly: the transcriptional regulatory element database for Drosophila.Nucleic Acids Res. 2019 Jan 8;47(D1):D828-D834. doi: 10.1093/nar/gky957. Nucleic Acids Res. 2019. PMID: 30329093 Free PMC article.
References
-
- Pagani I, Liolios K, Jansson J, Chen IM, Smirnova T, Nosrat B, Markowitz VM, Kyrpides NC. The Genomes OnLine Database (GOLD) v. 4: status of genomic and metagenomic projects and their associated metadata. Nucleic Acids Res. 2012;40(Database issue):D571–D579. doi: 10.1093/nar/gkr1100. - DOI - PMC - PubMed
Publication types
MeSH terms
Substances
LinkOut - more resources
Full Text Sources
Other Literature Sources
Molecular Biology Databases
Miscellaneous
