Review
. 2015 Jan;22(1):33-49.
doi: 10.1016/j.acra.2014.08.011. Epub 2014 Oct 22.

Clinical utility of quantitative imaging

Affiliations
Review

Clinical utility of quantitative imaging

Andrew B Rosenkrantz et al. Acad Radiol. 2015 Jan.

Abstract

Quantitative imaging (QI) is increasingly applied in modern radiology practice, assisting in the clinical assessment of many patients and providing a source of biomarkers for a spectrum of diseases. QI is commonly used to inform patient diagnosis or prognosis, determine the choice of therapy, or monitor therapy response. Because most radiologists will likely implement some QI tools to meet the patient care needs of their referring clinicians, it is important for all radiologists to become familiar with the strengths and limitations of QI. The Association of University Radiologists Radiology Research Alliance Quantitative Imaging Task Force has explored the clinical application of QI and summarizes its work in this review. We provide an overview of the clinical use of QI by discussing QI tools that are currently used in clinical practice, clinical applications of these tools, approaches to reporting of QI, and challenges to implementing QI. It is hoped that these insights will help radiologists recognize the tangible benefits of QI to their patients, their referring clinicians, and their own radiology practice.

Keywords: Radiology; biomarker; quantitative imaging; radiologist.


Figures

Figure 1
Figure 1
58-year-old man with concern for carotid artery stenosis. (A) Duplex ultrasound image shows spectral tracing obtained from the mid right internal carotid artery, with measurement of the corresponding peak systolic velocity and end-diastolic velocity. (B) Portion of corresponding radiology report providing findings relating to the right-sided carotid vasculature in tabular format. Based on the provided velocities, it was concluded that the degree of stenosis in the right internal carotid artery is <50%. This lack of hemodynamically significant stenosis, which could not be reliably determined based solely on subjective assessment of the appearance of the vessel, facilitates selection of non-operative management for the patient.
Figure 2
Figure 2
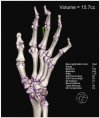
Volume-rendered image of the hand and wrist from dual-energy CT evaluation in patient with gout, demonstrating use of annotated color-coded volume-rendering to display quantitative results. Pixels with dual-energy absorption characteristics of uric acid crystals are highlighted in green, and the total volume of such pixels is reported. The urate volume can be used as a marker of response to urate-lowering therapy. Parameters used to perform the analysis can be included in the screen capture to facilitate use of similar parameters during follow-up. The image can be captured from the analysis software and stored as a DICOM image as part of the study, along with the original source images.
Figure 3
Figure 3
52-year-old man with a concern for hemochromatosis. (A) Images from a multi-echo T2*-weighted gradient-echo MR acquisition of the liver obtained using echo times (TEs) of 2.0 ms, 7.5 ms, and 23.8 ms. A total of eight different images, with TEs varying between 2.0 ms and 23.8 ms, were obtained. (B) Parametric T2* map was computed from the multi-echo images using a monoexponential fit. T2* values in the liver were in the range of 8–9 ms, consistent with moderate-to-severe hepatic iron deposition. Subjective assessment of multi-echo images indicates the presence of iron, but is limited for determining the severity of iron deposition.
Figure 3
Figure 3
52-year-old man with a concern for hemochromatosis. (A) Images from a multi-echo T2*-weighted gradient-echo MR acquisition of the liver obtained using echo times (TEs) of 2.0 ms, 7.5 ms, and 23.8 ms. A total of eight different images, with TEs varying between 2.0 ms and 23.8 ms, were obtained. (B) Parametric T2* map was computed from the multi-echo images using a monoexponential fit. T2* values in the liver were in the range of 8–9 ms, consistent with moderate-to-severe hepatic iron deposition. Subjective assessment of multi-echo images indicates the presence of iron, but is limited for determining the severity of iron deposition.
Figure 4
Figure 4
68-year-old man with lung cancer. (A) Baseline CT image allows determination of lesion volume before treatment (1.5 × 1.7cm). (B) CT image three months later, after chemotherapy, shows increase in size (2.3 × 2.8cm). These lesion measurements met criteria for progressive disease and resulted in an alteration of the patient's chemotherapy regimen.
Figure 4
Figure 4
68-year-old man with lung cancer. (A) Baseline CT image allows determination of lesion volume before treatment (1.5 × 1.7cm). (B) CT image three months later, after chemotherapy, shows increase in size (2.3 × 2.8cm). These lesion measurements met criteria for progressive disease and resulted in an alteration of the patient's chemotherapy regimen.
Figure 5
Figure 5
64-year-old woman with metastatic ovarian cancer. (A) Baseline CT and fused PET/CT images shows an anterior abdominal wall metastasis with marked increased metabolic activity [maximum standardized uptake value (SUVmax) 11.7]. (B) Follow-up CT and fused PET/CT images obtained after 3 months of treatment with paclitaxel shows similar size of the lesion, although there has been substantial interval decrease in metabolic activity (SUVmax 3.7). This interval decrease in SUV is consistent with response to therapy, which is not readily apparent based on evaluation of lesion size alone.
Figure 5
Figure 5
64-year-old woman with metastatic ovarian cancer. (A) Baseline CT and fused PET/CT images shows an anterior abdominal wall metastasis with marked increased metabolic activity [maximum standardized uptake value (SUVmax) 11.7]. (B) Follow-up CT and fused PET/CT images obtained after 3 months of treatment with paclitaxel shows similar size of the lesion, although there has been substantial interval decrease in metabolic activity (SUVmax 3.7). This interval decrease in SUV is consistent with response to therapy, which is not readily apparent based on evaluation of lesion size alone.
Figure 6
Figure 6
63-year-old man with Pancoast tumor. (A) Axial CT and fused 18F-FDG PET/CT images demonstrate right apical lung mass with markedly increased metabolic activity; standardized uptake value (SUV) was 14.0 (B) Axial CT and fused PET/CT images obtained five months after radiation and chemotherapy show similar appearance of mass on CT, although SUV has substantially decreased, now measuring 3.9. (C) CT and fused PET/CT images 11 months after treatment shows decreased size of mass on CT, although there is persistent pleural thickening. However, increased metabolic activity has resolved, with SUV now measuring 0.0. The decrease in SUV preceded an appreciable decrease in lesion size.
Figure 6
Figure 6
63-year-old man with Pancoast tumor. (A) Axial CT and fused 18F-FDG PET/CT images demonstrate right apical lung mass with markedly increased metabolic activity; standardized uptake value (SUV) was 14.0 (B) Axial CT and fused PET/CT images obtained five months after radiation and chemotherapy show similar appearance of mass on CT, although SUV has substantially decreased, now measuring 3.9. (C) CT and fused PET/CT images 11 months after treatment shows decreased size of mass on CT, although there is persistent pleural thickening. However, increased metabolic activity has resolved, with SUV now measuring 0.0. The decrease in SUV preceded an appreciable decrease in lesion size.
Figure 7
Figure 7
62-year-old woman with metastatic breast cancer and a right adrenal nodule. Non-contrast CT image shows the nodule measures -8 Hounsfield units (HU). This measurement meets non-contrast CT criteria for the diagnosis of a benign adrenal adenoma, allowing for the lesion to be characterized as benign. Further evaluation, such as contrast-enhanced CT, MRI, PET, or biopsy, is therefore avoided.
Figure 8
Figure 8
44-year-old woman undergoing evaluation of left adrenal mass detected on previous imaging. CT using an adrenal washout protocol was performed. Axial CT images show a density of 25 Hounsfield units (HU) in the unenhanced phase (A), not meeting criteria for a lipid-rich adenoma. However, the density was 83 HU in the portal venous phase (B) and 29 HU in the 15-minute delayed phase (C), corresponding with an absolute wash-out ratio (AWR) of 93%. This AWR is greater than a threshold of 60%, indicating with high specificity that the lesion is a benign adenoma.
Figure 8
Figure 8
44-year-old woman undergoing evaluation of left adrenal mass detected on previous imaging. CT using an adrenal washout protocol was performed. Axial CT images show a density of 25 Hounsfield units (HU) in the unenhanced phase (A), not meeting criteria for a lipid-rich adenoma. However, the density was 83 HU in the portal venous phase (B) and 29 HU in the 15-minute delayed phase (C), corresponding with an absolute wash-out ratio (AWR) of 93%. This AWR is greater than a threshold of 60%, indicating with high specificity that the lesion is a benign adenoma.
Figure 9
Figure 9
68-year-old man with metastatic renal cell carcinoma. (A) Baseline CT image shows a cluster of metastatic lesions in the pancreatic tail with decreased attenuation centrally and a hypervascular rim. (B) Follow-up CT image after 3 months of treatment with pazopanib shows similar size of the lesions, although there is decreased attenuation of portions of the lesions compared with the baseline image. This interval decrease in attenuation indicates reduced vascularity due to response to the anti-angiogenic therapy, which is not readily apparent based on evaluation of lesion size alone, and helps guide subsequent treatment decisions.
Figure 9
Figure 9
68-year-old man with metastatic renal cell carcinoma. (A) Baseline CT image shows a cluster of metastatic lesions in the pancreatic tail with decreased attenuation centrally and a hypervascular rim. (B) Follow-up CT image after 3 months of treatment with pazopanib shows similar size of the lesions, although there is decreased attenuation of portions of the lesions compared with the baseline image. This interval decrease in attenuation indicates reduced vascularity due to response to the anti-angiogenic therapy, which is not readily apparent based on evaluation of lesion size alone, and helps guide subsequent treatment decisions.
Figure 10
Figure 10
64-year-old woman with right sided weakness. (A) Parametric map of cerebral blood flow (CBF) shows decreased CBF in the left middle cerebral artery territory. (B) Parametric map of cerebral blood volume (CBV) shows corresponding decreased CBV. (C) Parametric map of mean transit time (MTT) shows corresponding increased MTT. Prolonged MTT over 6 seconds and reduced CBF of 10–15 ml/100g/min are consistent with infarction, indicating permanent damage to this vascular distribution. These measurements contributed to decision to not perform thrombolysis. The assessment of tissue viability was not reliably determined using conventional anatomic imaging alone.
Figure 10
Figure 10
64-year-old woman with right sided weakness. (A) Parametric map of cerebral blood flow (CBF) shows decreased CBF in the left middle cerebral artery territory. (B) Parametric map of cerebral blood volume (CBV) shows corresponding decreased CBV. (C) Parametric map of mean transit time (MTT) shows corresponding increased MTT. Prolonged MTT over 6 seconds and reduced CBF of 10–15 ml/100g/min are consistent with infarction, indicating permanent damage to this vascular distribution. These measurements contributed to decision to not perform thrombolysis. The assessment of tissue viability was not reliably determined using conventional anatomic imaging alone.
Figure 11
Figure 11
23-year-old pregnant woman undergoing fetal survey. (A) Ultrasound biometric measurements include biparietal diameter, head circumference, abdominal circumference, and femur length. (B) Tabular summary uses biometric measurements to provide an estimated fetal gestational age, which can be correlated to gestational age based on last menstrual period, as well as used to compute an estimated fetal weight and growth percentile. These data are used to diagnose fetuses with intrauterine growth restriction.
Figure 11
Figure 11
23-year-old pregnant woman undergoing fetal survey. (A) Ultrasound biometric measurements include biparietal diameter, head circumference, abdominal circumference, and femur length. (B) Tabular summary uses biometric measurements to provide an estimated fetal gestational age, which can be correlated to gestational age based on last menstrual period, as well as used to compute an estimated fetal weight and growth percentile. These data are used to diagnose fetuses with intrauterine growth restriction.
Figure 12
Figure 12
Sample multimedia report generated for volumetric renal stone quantification assessment in a 40 year-old male with history of nephrolithiasis; report content has been de-identified. This report may be included in the EMR as a scanned document, PDF, screen capture image as part of the DICOM images for the study, or be printed for a paper medical record. The multimedia report generally contains selected images to highlight key findings. A separately generated text report is typically available in the radiology reporting system or associated with the multimedia report as a separate page.
Figure 13
Figure 13
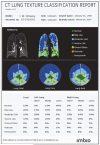
Sample advanced multimedia report for quantitative lung texture assessment from high-resolution pulmonary CT in 67 year-old male with 110 pack-year smoking history who is a candidate for long volume reduction surgery (LVRS); report content has been de-identified. The pulmonary parenchymal evaluation is performed using CALIPER (Computer-Aided Lung Informatics for Pathology Evaluation and Rating), a CT-based technology developed at Mayo Clinic, that provides qualitative and quantitative assessment of different tissue types for diffuse parenchymal lung diseases based on lung density signatures and morphology. The quantitative analysis shows this patient has upper-lobe predominant disease, and therefore is a potential candidate for LVRS. A segmentation overview, with color overlay of the segmented CT data, is provided in the report. Quantitative results are represented in a summary chart, and colored graphs represent the extent and type of parenchymal classification. (Report courtesy of Imbio, LLC, Minneapolis MN.)
Figure 14
Figure 14
CT-colonography image in which a pedunculated polyp is colored grey within a surface-shaded rendering of the colon lumen. Polyp diameter and volume are presented as an overlay on the rendering. Case exhibits use of colored and/or annotated renderings to convey quantitative results. The image can be captured from the analysis software and stored as a DICOM image as part of the study, along with the original source images

References

    1. Radiological Society of North America [Accessed on January 12, 2014];Quantitative Imaging Biomarkers Alliance. Available at: http://www.rsna.org/QIBA.aspx.
    1. Taylor KJ, Burns PN. Duplex Doppler scanning in the pelvis and abdomen. Ultrasound Med Biol. 1985;11(4):643–58. - PubMed
    1. Pearce WH, Astleford P. What's new in vascular ultrasound. Surg Clin North Am. 2004;84(4):1113–26. vii. - PubMed
    1. Ardalan MR, Tarzamani MK, Shoja MM. A correlation between direct and indirect Doppler ultrasonographic measures in transplant renal artery stenosis. Transplant Proc. 2007;39(5):1436–8. - PubMed
    1. Kruskal JB, Newman PA, Sammons LG, Kane RA. Optimizing Doppler and color flow US: application to hepatic sonography. Radiographics. 2004;24(3):657–75. - PubMed

Publication types