. 2015 Mar;21(3):241-51.
doi: 10.1111/cns.12347. Epub 2014 Dec 1.

Brivaracetam differentially affects voltage-gated sodium currents without impairing sustained repetitive firing in neurons

Affiliations

Brivaracetam differentially affects voltage-gated sodium currents without impairing sustained repetitive firing in neurons

Isabelle Niespodziany et al. CNS Neurosci Ther. 2015 Mar.

Abstract

Aims: Brivaracetam (BRV) is an antiepileptic drug in Phase III clinical development. BRV binds to synaptic vesicle 2A (SV2A) protein and is also suggested to inhibit voltage-gated sodium channels (VGSCs). To evaluate whether the effect of BRV on VGSCs represents a relevant mechanism participating in its antiepileptic properties, we explored the pharmacology of BRV on VGSCs in different cell systems and tested its efficacy at reducing the sustained repetitive firing (SRF).

Methods: Brivaracetam investigations on the voltage-gated sodium current (I(Na)) were performed in N1E-155 neuroblastoma cells, cultured rat cortical neurons, and adult mouse CA1 neurons. SRF was measured in cultured cortical neurons and in CA1 neurons. All BRV (100-300 μM) experiments were performed in comparison with 100 μM carbamazepine (CBZ).

Results: Brivaracetam and CBZ reduced IN a in N1E-115 cells (30% and 40%, respectively) and primary cortical neurons (21% and 47%, respectively) by modulating the fast-inactivated state of VGSCs. BRV, in contrast to CBZ, did not affect I(Na) in CA1 neurons and SRF in cortical and CA1 neurons. CBZ consistently inhibited neuronal SRF by 75-93%.

Conclusions: The lack of effect of BRV on SRF in neurons suggests that the reported inhibition of BRV on VGSC currents does not contribute to its antiepileptic properties.

Keywords: Action potential firing; Antiepileptic drug; Neurons; Voltage-gated sodium channel.


Conflict of interest statement

All authors are employed by UCB Pharma, Belgium.

Figures
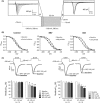
Figure 1
Figure 1
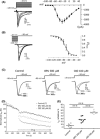
Effect of brivaracetam (BRV) and carbamazepine (CBZ) on INa recorded in N1E‐115 cells. (A) Stimulation protocol applied on N1E‐115 cells to evaluate the effects of BRV (1–10–100 μM) and CBZ (1–10–100 μM) on activation (a) and fast inactivation (b) properties of INa. Traces in insets represent typical examples of INa recorded from resting state of VGSCs (a, left inset) and used to calculate INa activation curve, and of INa activated from preconditioning steps (b, right inset) and used to calculate INa fast inactivation curve. (B) Steady‐state fast inactivation of INa obtained from “b” in the protocol described in (A) was evaluated under control conditions (Control, n = 5), or in the presence of BRV (n = 5), or CBZ (n = 5). Graphs represent normalized INa activated at −10 mV following preconditioning steps and measured before (open symbols) and after a 35‐min perfusion with control solution or 100 μM test drug (filled symbols). The results are expressed as mean ± SEM. The mean values were fitted (lines) with a Boltzman function. The potentials for half‐inactivation (V50) were calculated on individual cells and then averaged. (C) To evaluate VGSC state dependency of INa inhibition induced by BRV and CBZ, INa was activated by 20 ms depolarizing pulses applied at 1 Hz from a holding potential at −120 mV (resting state) or −80 mV (corresponding toV50 of inactivation). Insets show representative traces of INa activated from −120 mV and from −80 mV, before (in black) and after 100 μM drug (in gray) perfusion. Bars represent mean percentages (+SD) of residual INa normalized to predrug INa (baseline) for the number n of neurons. Significant differences versus baseline value are indicated with ★★(P < 0.01) and (P < 0.05) using paired two‐tailed t‐test.
Figure 2
Figure 2
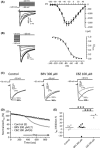
Effect of brivaracetam (BRV) and carbamazepine (CBZ) on INa recorded in rat primary cortical neurons. (A) Mean I–V curve of INa recorded from a holding potential of −120 mV before application of the drugs. Data represent mean ± SEM for 19 neurons. Extrapolation of the curve indicates a reversal potential of the current around +50 mV. Representative INa traces recorded from the protocol used to assess activation properties of INa are illustrated on the left. (B) Mean INa fast inactivation curve normalized to maximal INa recorded before application of the drugs. Data represent mean ± SD for 19 neurons. Representative INa traces recorded from the protocol used to assess fast inactivation properties of INa are illustrated on the left. (C) Representative currents elicited by a depolarizing step at −20 mV from the inactivation V50 of the recorded neurons. Superimposed traces represent currents before (300 seconds in black) and after 100‐second perfusion (400 seconds in gray) with control solution, BRV, or CBZ. (D) Time course of INa activated at 0.1 Hz under control conditions (100–300 seconds) and during perfusion with control (n = 7), 300 μM BRV (n = 8), and 100 μM CBZ (n = 4) (300–900 seconds). Symbols represent the mean. (E) Percentage of INa inhibition for control, BRV and CBZ groups measured using a linear biregression fitting (see Materials and Methods) of the curves illustrated in (D). Symbols represent individual values and means are indicated with horizontal bars within groups. Significant differences in INa inhibition values (ANOVA and post hoc LSD test: ★★★ P < 0.001) were found between both drug groups and the control group and between BRV group and CBZ group.
Figure 3
Figure 3
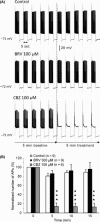
Effect of brivaracetam (BRV) and carbamazepine (CBZ) on sustained repetitive firing (SRF) recorded in rat primary cortical neurons. (A) Traces represent concatenate display of SRFs recorded for 5 min (baseline) before and 5 min during application of either control solution or 300 μM BRV or 100 μM CBZ in different primary cortical neurons. SRF was evoked by repetitive 5‐second depolarizing current steps with stimulation intensity adapted for each neuron (control neuron, I = 150 pA; CBZ neuron, I = 70 pA; BRV neuron, I = 250 pA) and applied every minute from the resting membrane potential of the neurons (indicated at the left of each trace). The vertical dashed line corresponds to the onset of drug perfusion. (B) Graph represents the time course of the normalized number of action potential (APs) per step recorded during 15‐min perfusion with control solution or with the drug. Normalization was performed with the number of APs elicited by the last step recorded during baseline. Bars are mean + SEM for the number of neurons n. Statistical differences between CBZ group and control group are indicated with ★★★ P < 0.001 (unpaired two‐tailed t‐test).
Figure 4
Figure 4
Effect of brivaracetam (BRV) and carbamazepine (CBZ) on IN a recorded in CA1 neurons from mouse hippocampal slices. (A) Mean I–V curve of IN a recorded before application of the drugs. Data represent mean ± SD for 16 neurons. Extrapolation of the curve indicates a reversal potential of the current around +50 mV. Representative series of IN a traces recorded from the protocol are illustrated on the left. (B) IN a fast inactivation curve normalized to maximal IN a recorded before application of the drugs. Data represent mean ± SEM for 16 neurons. Representative series of IN a traces recorded from the protocol are illustrated on the left. (C) Representative currents elicited by a depolarizing step inducing peak IN a from V50 value for IN a inactivation adapted for each neuron. Superimposed traces represent currents before (300 seconds in black) and after 600‐second perfusion (900 seconds in gray) with control, BRV, or CBZ. (D) Time course of IN a activated at 0.1 Hz under control conditions (0–300 seconds) and during perfusion with control, 300 μM BRV, and 100 μM CBZ (300–900 seconds). Symbols represent the mean value for the number of neurons (n). (E) Percentage of IN a inhibition for control, BRV, and CBZ groups measured using a linear biregression fitting (see Methods) of the curves illustrated in (D). Symbols represent individual values and means are indicated with horizontal bars within groups. Significant differences between CBZ group and control group and between BRV group and CBZ group are indicated with ★★★(P < 0.001, ANOVA and post hoc LSD test).
Figure 5
Figure 5
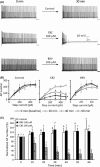
Effect of brivaracetam (BRV) and carbamazepine (CBZ) on sustained repetitive firing (SRF) evoked in CA1 neurons from mouse hippocampal slices. (A) Representative traces of SRF recorded before (0 min) and after 30 min treatment with either control solution, 100 μM CBZ or 100 μM BRV in three different CA1 hippocampal neurons. SRF was induced by a 10 seconds depolarizing current step (step current intensity for the displayed examples: 300 pA) applied from a potential held at −60 mV. (B) Graphs represent the number of action potential (APs) elicited per series of increasing depolarizing steps recorded at different time points before (0 min = baseline) and after perfusion (20 min, 40 min and 60 min) with control solution (n = 5–8 neurons), 100 μM BRV (n = 7 neurons), and 100 μM CBZ (n = 4–7 neurons). The number of APs according to stimulation intensity in control group and in BRV group was not different from their respective baseline curve. In the CBZ group, the number of APs was significantly reduced compared to the baseline curve (paired two‐tailed t‐test: P < 0.05) after 20 min perfusion with the drug and this reduction was maximal after 40 min perfusion. Symbols and errors bars represent means and SEMs, respectively. (C) Bar graph represent normalized APs number induced by the 400 pA depolarizing step recorded at different time points after perfusion with control solution, 100 μM BRV or 100 μM CBZ. Number of APs was normalized to the number of APs elicited predrug (time 0). Values in the BRV group and in the control group were not different throughout the 60‐min experiment. Comparison of values obtained in the CBZ group and in the control group showed significant differences (unpaired two‐tailed t‐test: P < 0.05; ★★ P < 0.01; ★★★ P < 0.001) after a 10‐min drug perfusion. Bars represent means + SEMs for the number of neurons indicated above error bars.

References

    1. Kasteleijn‐Nolst Trenite DG, Genton P, Parain D, et al. Evaluation of brivaracetam, a novel SV2A ligand, in the photosensitivity model. Neurology 2007;69:1027–1034. - PubMed
    1. Malawska B, Kulig K. Brivaracetam: A new drug in development for epilepsy and neuropathic pain. Expert Opin Investig Drugs 2008;17:361–369. - PubMed
    1. Van Paesschen W, Hirsch E, Johnson M, Falter U, von Rosenstiel P. Efficacy and tolerability of adjunctive brivaracetam in adults with uncontrolled partial‐onset seizures: A phase IIb, randomized, controlled trial. Epilepsia 2013;54:89–97. - PubMed
    1. Kwan P, Trinka E, Van Paesschen W, Rektor I, Johnson ME, Lu S. Adjunctive brivaracetam for uncontrolled focal and generalized epilepsies: Results of a phase III, double‐blind, randomized, placebo‐controlled, flexible‐dose trial. Epilepsia 2014;55:38–46. - PubMed
    1. Ryvlin P, Werhahn KJ, Blaszczyk B, Johnson ME, Lu S. Adjunctive brivaracetam in adults with uncontrolled focal epilepsy: Results from a double‐blind, randomized, placebo‐controlled trial. Epilepsia 2014;55:47–56. - PubMed

MeSH terms