. 2015 Jan:36 Suppl 1:S3-S10.
doi: 10.1016/j.neurobiolaging.2014.06.032. Epub 2014 Aug 29.

Amygdalar atrophy in symptomatic Alzheimer's disease based on diffeomorphometry: the BIOCARD cohort

Collaborators, Affiliations

Amygdalar atrophy in symptomatic Alzheimer's disease based on diffeomorphometry: the BIOCARD cohort

Michael I Miller et al. Neurobiol Aging. 2015 Jan.

Abstract

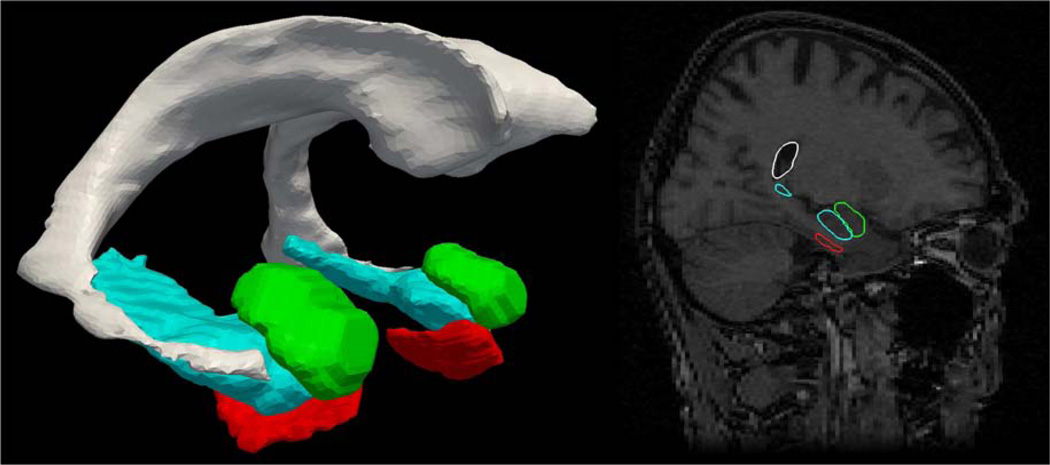
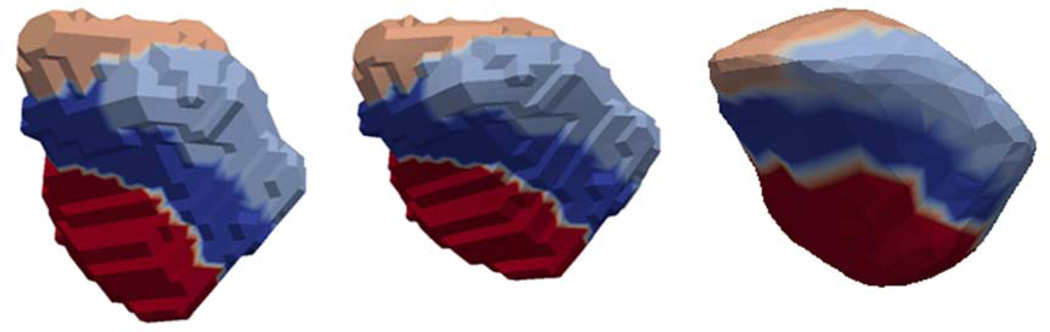
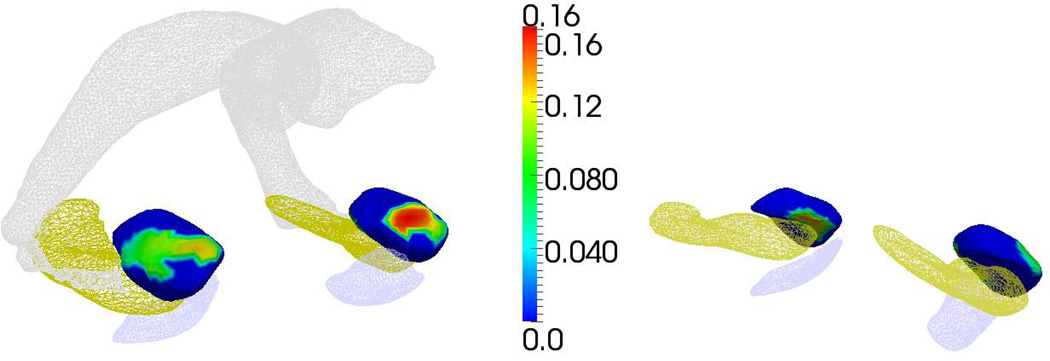
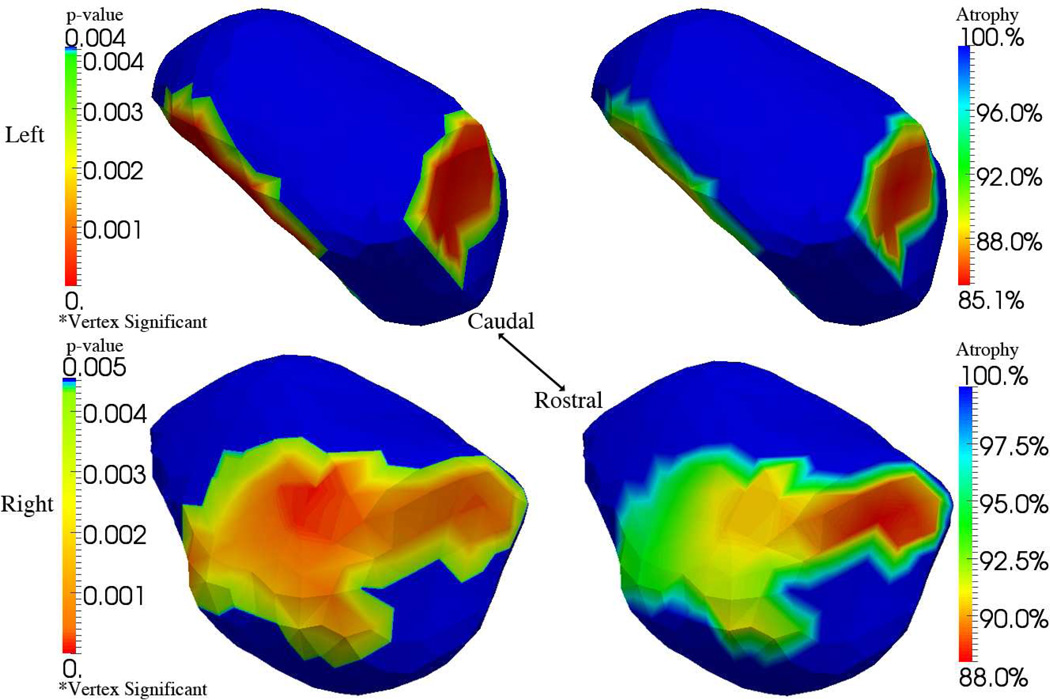
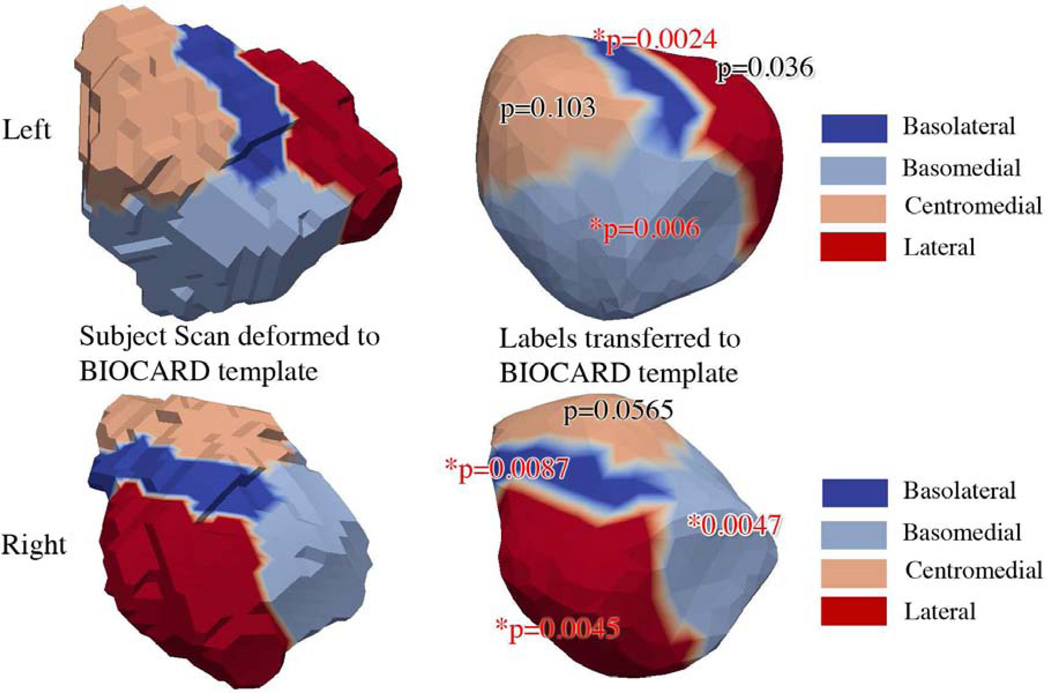
This article examines the diffeomorphometry of magnetic resonance imaging-derived structural markers for the amygdala, in subjects with symptomatic Alzheimer's disease (AD). Using linear mixed-effects models we show differences between those with symptomatic AD and controls. Based on template centered population analysis, the distribution of statistically significant change is seen in both the volume and shape of the amygdala in subjects with symptomatic AD compared with controls. We find that high-dimensional vertex based markers are statistically more significantly discriminating (p < 0.00001) than lower-dimensional markers and volumes, consistent with comparable findings in presymptomatic AD. Using a high-field 7T atlas, significant atrophy was found to be centered in the basomedial and basolateral subregions, with no evidence of centromedial involvement.

Keywords: Alzheimer's disease; Amygdala; MCI; MRI; Shape.


Conflict of interest statement

Disclosure Statement: All authors do not have conflicts of interest.

Figures

Figure 1
Figure 1
Left: surface reconstruction of amygdala (green), entorhinal cortex (red), hippcampus (blue), ventricle (gray) from one BIOCARD subject. Right: Corresponding MRI section with reconstructed structures embedded in the MRI volume.
Figure 2
Figure 2
High-field 7T amygdala template (left) mapped into the 1.5T population coordinates (middle); regions correspond to parcellation into four subnuclei: lateral (red), basolateral (blue) baso-medial (sky-blue), centromedial (caramel). The figure on the right shows a labeling into the 4 subfield parcellation of the 1.5 T population atlas generated by transferring the labels in the closest vertex (middle) to the 1.5T coordinate system.
Figure 3
Figure 3
Statistically significant family wise error rate (FWER) at 5% significance for the mixed effects modeling of the symptomatic group compared to the controls, demonstrating atrophy for left and right amygdala. Left panel shows statistics depicted from medial-rostral aspect; right panel shows depiction from medial-caudal aspect. Statistically significant vertex coloring given by the natural log of the surface Jacobian β + β′ā indexed over the template between the control vs symptomatic groups corrected at the average age. For reference only, shown are entorhinal cortex, hippocampus and lateral ventricle.
Figure 4
Figure 4
Results of mixed effects modeling of the symptomatic group compared to the controls. The top and bottom rows portray the left and right amygdala respectively, showing the p-values (left) and degree of atrophy shown as a percentage decrease relative to the template (right) for the 7T regions projected onto the significant high-field regions, i.e., the basolateral and basomedial nuclei. The blue in the figure on the left implies vertex statistics that are not-significant for FWER 5%;. The blue in the figure on the right implies no atrophy relative to template (determinant Jacobian=1).
Figure 5
Figure 5
Results of mixed effects modeling of the symptomatic group compared to the controls for the nuclei of the amygdala. The figures on the left show the 7T high-field left amygdala template (top row) with four subfields defined from the 0.8mm isotropic 7T MRI; the bottom row shows right high-field amygdala. The figures on the right show the subfields transferred to the 1.5T population template showing statistically significant subregions. Significance is determined at .05 FWER, based on Bonferroni bound p<.0125. The top row shows the basomedial (p=.0024) and basolateral (p=.006), with no significance lateral (p=.036) and centromedial (p=.103) for the left amygdala. The bottom row, right column, shows statistically significant subregions, basomedial (p=.0087), basolateral (p=.0047), lateral (p=.0045), with no significance centromedial (p=.0565).

References

    1. Arnold SE, Hyman BT, Flory J, Damasio AR, Van Hoesen GW. The topographical and neuroanatomical distribution of neurofibrillary tangles and neuritic plaques in the cerebral cortex of patients with Alzheimer's disease. Cereb Cortex. 1991;1(1):103–116. - PubMed
    1. Arriagada PV, Growdon JH, Hedley-Whyte ET, Hyman BT. Neurofibrillary tangles but not senile plaques parallel duration and severity of Alzheimer's disease. Neurology. 1992;42(3 Pt 1):631–639. - PubMed
    1. Ashburner J, Csernansky JG, Davatzikos C, Fox NC, Frisoni GB, Thompson PM. Computer-assisted imaging to assess brain structure in healthy and diseased brains. Lancet Neurol. 2003;2(2):79–88. - PubMed
    1. Atiya M, Hyman BT, Albert MS, Killiany R. Structural magnetic resonance imaging in established and prodromal Alzheimer disease: a review. Alzheimer disease and associated disorders. 2003;17(3):177–195. - PubMed
    1. Beg MF, Miller MI, Trouve A, Younes L. Computing large deformation metric mappings via geodesic flows of diffeomorphisms. International Journal of Computer Vision. 2005;61(2):139–157.

Publication types