. 2015 Jan;36 Suppl 1(Suppl 1):S91-S102.
doi: 10.1016/j.neurobiolaging.2014.05.040. Epub 2014 Sep 6.

Thickness network features for prognostic applications in dementia

Affiliations

Thickness network features for prognostic applications in dementia

Pradeep Reddy Raamana et al. Neurobiol Aging. 2015 Jan.

Abstract

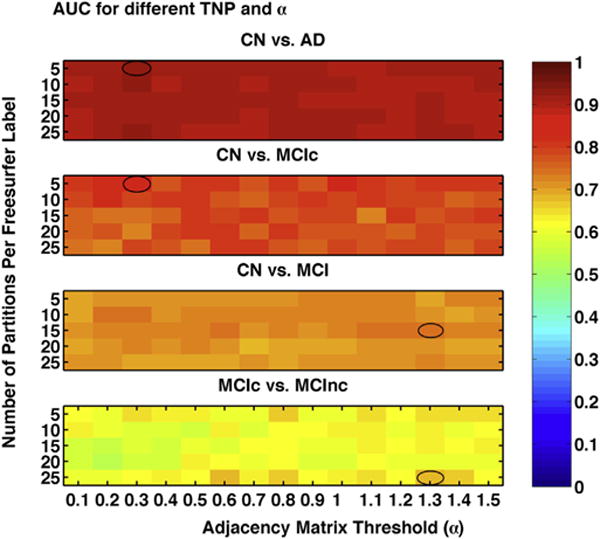
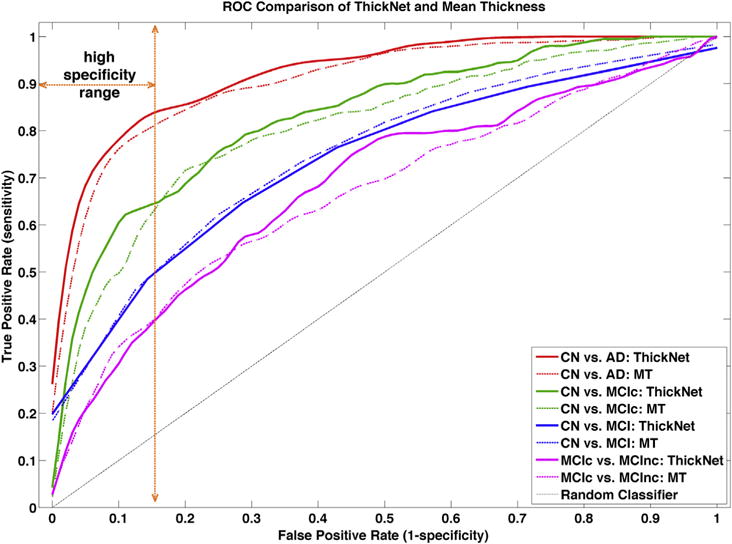
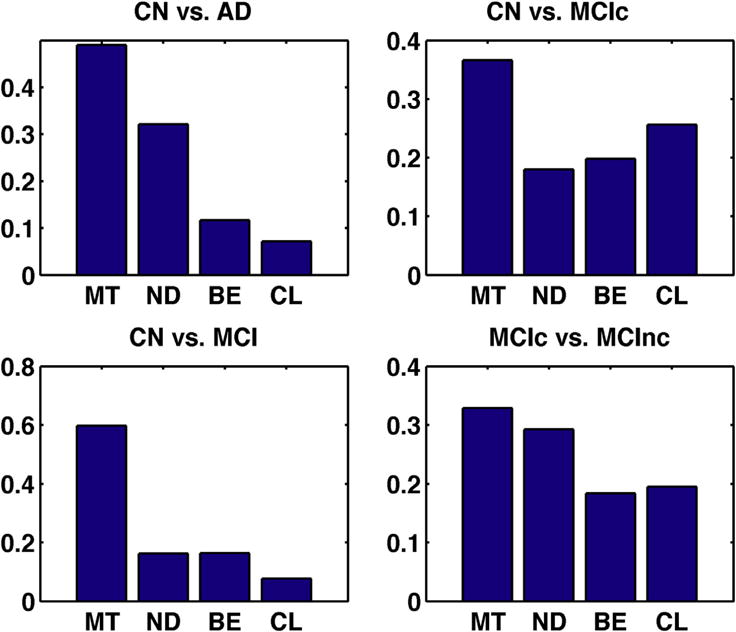
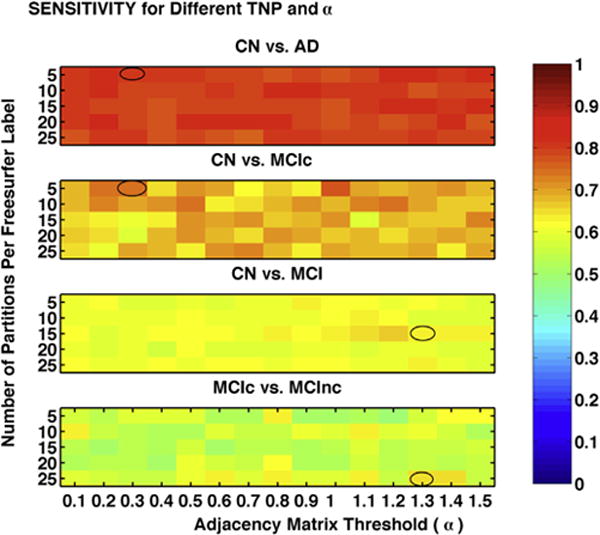
Regional analysis of cortical thickness has been studied extensively in building imaging biomarkers for early detection of Alzheimer's disease but not its interregional covariation of thickness. We present novel features based on the inter-regional covariation of cortical thickness. Initially, the cortical labels of each subject are partitioned into small patches (graph nodes) by spatial k-means clustering. A graph is then constructed by establishing a link between 2 nodes if the difference in thickness between the nodes is below a certain threshold. From this binary graph, a thickness network is computed using nodal degree, betweenness, and clustering coefficient measures. Fusing them with multiple kernel learning, it is observed that thickness network features discriminate mild cognitive impairment (MCI) converters from controls (CN) with an area under curve (AUC) of 0.83, 74% sensitivity and 76% specificity on a large subset obtained from the Alzheimer's Disease Neuroimaging Initiative data set. A comparison of predictive utility in Alzheimer's disease and/or CN classification (AUC of 0.92, 80% sensitivity [SENS] and 90% specificity [SPEC]), in discriminating CN from MCI (converters and nonconverters combined; AUC of 0.75, SENS and SPEC of 64% and 73%, respectively) and in discriminating between MCI nonconverters and MCI converters (AUC of 0.68, SENS and SPEC of 65% and 64%) is also presented. ThickNet features as defined here are novel, can be derived from a single magnetic resonance imaging scan, and demonstrate the potential for the computer-aided prognostic applications.

Keywords: Alzheimer; Cortical thickness; Early detection; Fusion; Mild cognitive impairment; Multiple kernel learning; Network properties.


Conflict of interest statement

Disclosure statement

All the authors declare that they have no conflicts of interest.

Figures

Fig. 1
Fig. 1
Flow chart describing the steps involved in the extraction of ThickNet features. Once the pial surfaces from all the subjects are registered to a common atlas, we subdivide the cortex of the atlas surface into a fixed number of partitions (or patches). This subdivision is propagated into cortical surface of each subject and mean thickness within each partition is computed for all the patches in every subject. Based on the similarity in thickness, links are defined between various pairs of partitions with difference in mean thickness below a certain threshold. The Boolean link status between all the pairwise connections forms the adjacency matrix of the graph. From this graph, we compute various ThickNet features. Please refer to Section 2.4 for a detailed description. (For interpretation of the references to color in this Figure, the reader is referred to the web version of this article.)
Fig. 2
Fig. 2
Visualization of the partitions on the atlas surface in the medial view (A) and lateral view (B), when TNP = 680. Also visualized here in C and D are the group differences in the mean thickness, that is, mean(CN)-mean(MCIc) at each partition, rescaled to [0,1] to enable comparison with other ThickNet features show in Fig. 3. Abbreviations: CN, controls; MCIc, mild cognitive impairment converters; TNP, total number of partitions. (For interpretation of the references to color in this Figure, the reader is referred to the web version of this article.)
Fig. 3
Fig. 3
Visualization of the differences in group means, that is, mean(CN)-mean(MCIc) at each partition, of the ThickNet features when TNP = 680 and α = 0.30. Left column presents the medial view and the right column presents the lateral view of the group differences in each feature. The values of each feature in A–F are normalized to [0,1] to enable comparison across features. These values do not have any applicable units. Abbreviations: CN, controls; MCIc, mild cognitive impairment converters; TNP, total number of partitions. (For interpretation of the references to color in this Figure, the reader is referred to the web version of this article.)
Fig. 4
Fig. 4
Flowchart illustrating the performance evaluation procedure utilized in this study. The training set is stratified in the sense that there is no class-imbalance (all the classes are equal in size) to limit any bias toward 1 particular class. Please note, this procedure is repeated 100 times. In each repetition, the performance metrics are computed based on the predictions from the corresponding test set only. In other words, we do not pool predictions across different repetitions, which may invalidate the computation of AUC. That would be invalid because the prediction scores in different repetitions are obtained from different classifiers, which may not be comparable or calibrated. Abbreviation: AUC, area under curve. (For interpretation of the references to color in this Figure, the reader is referred to the web version of this article.)
Fig. 5
Fig. 5
Comparison of AUC obtained from RHsT method for each combination of NPP and α. The combination with the best performance in each experiment is highlighted with a black oval. Abbreviations: AD, Alzheimer’s disease; AUC, area under curve; MCI, mild cognitive impairment; MCIc, mild cognitive impairment converters; MCInc, mild cognitive impairment nonconverters; NPP, number of partitions per freesurfer label; RHsT, repeated hold-out, stratified training set; TNP, total number of partitions. (For interpretation of the references to color in this Figure, the reader is referred to the web version of this article.)
Fig. 6
Fig. 6
Comparison of ROC curves corresponding with the best performance of ThickNet fusion method in each experiment, displayed using solid lines. We also compare these ROC curves with those of mean thickness (MT) features. This comparison shows that ThickNet features outperform the MT features (dashed lines) in all the experiments except CN versus MCI. Abbreviations: CN, controls; MCI, mild cognitive impairment; ROC, receiver operating characteristic. (For interpretation of the references to color in this Figure, the reader is referred to the web version of this article.)
Fig. 7
Fig. 7
Individual contribution of ThickNet features toward classification in the probabilistic multiple kernel learning framework. These results show that all the ThickNet features contributed to discrimination, although in varying proportions. Note that, mean thickness contributed in all the classification problems, whereas the contribution of ThickNet features increased with increasing difficulty of the problem such as CN versus MCIc and MCIc versus MCInc. This only asserts their utility for the prognostic applications. Abbreviations: BE, betweenness centrality; CL, clustering coefficient; MT, mean thickness; ND, nodal degree. (For interpretation of the references to color in this Figure, the reader is referred to the web version of this article.)
Fig. 8
Fig. 8
Comparison of sensitivity, as a function of TNP and α, obtained from RHsT method. The combination with the best performance (highest AUC) in each experiment is highlighted with a black oval. Abbreviations: AD, Alzheimer’s disease; AUC, area under curve; MCI, mild cognitive impairment; MCIc, mild cognitive impairment converters; MCInc, mild cognitive impairment nonconverters; RHsT, repeated hold-out, stratified training set; TNP, total number of partitions. (For interpretation of the references to color in this Figure, the reader is referred to the web version of this article.)
Fig. 9
Fig. 9
Comparison of specificity, as a function of TNP and α, obtained from RHsT method. The combination with the best performance (highest AUC) in each experiment is highlighted with a black oval. Abbreviations: AD, Alzheimer’s disease; AUC, area under curve; MCI, mild cognitive impairment; MCIc, mild cognitive impairment converters; MCInc, mild cognitive impairment nonconverters; RHsT, repeated hold-out, stratified training set; TNP, total number of partitions. (For interpretation of the references to color in this Figure, the reader is referred to the web version of this article.)

References

    1. Alexander-Bloch A, Giedd JN, Bullmore E. Imaging structural co-variance between human brain regions. Nat Rev Neurosci. 2013a;14:322–336. - PMC - PubMed
    1. Alexander-Bloch A, Raznahan A, Bullmore E, Giedd J. The convergence of maturational change and structural covariance in human cortical networks. J Neurosci. 2013b;33:2889–2899. - PMC - PubMed
    1. Alzheimer’s Association. 2012 Alzheimer’s disease facts and figures. Alzheimer’s Dement. 2012;8:131–168. - PubMed
    1. Amieva H, Le Goff M, Millet X, Orgogozo JM, Pérès K, Barberger Gateau P, Jacqmin Gadda H, Dartigues JF. Prodromal Alzheimer’s disease: successive emergence of the clinical symptoms. Ann Neurol. 2008;64:492–498. - PubMed
    1. Bassett DS, Bullmore E, Verchinski BA, Mattay VS, Weinberger DR, Meyer-Lindenberg A. Hierarchical organization of human cortical networks in health and schizophrenia. J Neurosci. 2008;28:9239–9248. - PMC - PubMed

Publication types