Review
. 2015 May;166(4):303-17.
doi: 10.1016/j.resmic.2014.10.010. Epub 2014 Nov 4.

Genomes, neurotoxins and biology of Clostridium botulinum Group I and Group II

Affiliations
Review

Genomes, neurotoxins and biology of Clostridium botulinum Group I and Group II

Andrew T Carter et al. Res Microbiol. 2015 May.

Abstract

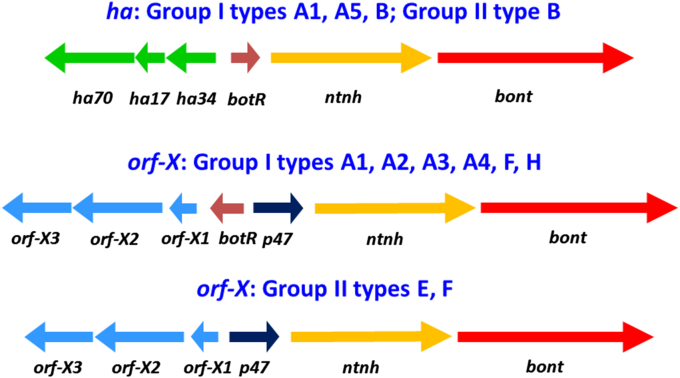
Recent developments in whole genome sequencing have made a substantial contribution to understanding the genomes, neurotoxins and biology of Clostridium botulinum Group I (proteolytic C. botulinum) and C. botulinum Group II (non-proteolytic C. botulinum). Two different approaches are used to study genomics in these bacteria; comparative whole genome microarrays and direct comparison of complete genome DNA sequences. The properties of the different types of neurotoxin formed, and different neurotoxin gene clusters found in C. botulinum Groups I and II are explored. Specific examples of botulinum neurotoxin genes are chosen for an in-depth discussion of neurotoxin gene evolution. The most recent cases of foodborne botulism are summarised.

Keywords: Botulinum neurotoxin; Botulism; Clostridium botulinum; Genomics; Neurotoxin gene cluster.


Figures

Fig. 1
Fig. 1
Two major neurotoxin cluster arrangements in C. botulinum Group I and C. botulinum Group II . Note that the botR gene, the product of which acts as a positive regulator for expression of the neurotoxin gene cluster, is not present in C. botulinum Group II orf-X neurotoxin gene clusters.
Fig. 2
Fig. 2
ACT comparisons of C. botulinum genomes. Red blocks indicate DNA homology (>90%) between paired genomes. Circular genomes are represented as linear horizontal black bars, with the gene annotated as coming first after each origin of replication positioned at the left hand end of each bar. A: C. botulinum Group I genomes of strains forming neurotoxins types A, B and F. B: C. botulinum Group I genomes of strains forming neurotoxin subtypes A1 – A5. C: Genomes of the C. botulinum Group I strain ATCC 3502, the C. botulinum Group II strain Eklund 17B, and the non-neurotoxigenic C. sporogenes ATCC 15579. Note that the contigs available in GenBank for the unfinished genome of C. sporogenes ATCC 15579 have been manually edited to generate a ‘best fit’ genome. The arrows below the black bar representing the genome of ATCC 15579 are coloured according to contig number: red, contig 488 (GenBank accession number ABKW02000002); light blue, contig 478 (ABKW02000003); green, contig 493 (ABKW02000004); dark blue, contig 486 (ABKW02000001). The arrows also indicate whether the contigs have been reverse/complemented in order to respect the genome of ATCC 3502, and that two contigs (478 and 488) have been broken apart, also in order to match this genome. D: Genomes of the C. botulinum Group II strains Beluga, Alaska and Eklund 17B. (For interpretation of the references to colour in this figure legend, the reader is referred to the web version of this article.)
Fig. 3
Fig. 3
Heatmaps and dendrograms generated by two colour microarray analysis of genomic DNA from strains of C. botulinum Group I (panel A) and of C. botulinum Group II (panel B). Microarray probes for the C. botulinum Group I analysis were derived from the genome sequence of ATCC 3502 and for the C. botulinum Group II analysis from the genome sequence of Eklund 17B . Competitive hybridisations for the C. botulinum Group I analyses were performed by mixing genomic DNA of strain ATCC 3502 with that of the test strain, each DNA having been labelled with a different fluorescent dye, before adding to the microarray. Similarly, labelled DNA from strain Eklund 17B was used as the hybridisation reference for the C. botulinum Group II experiments. In each heatmap, a yellow colour signals that the test strain genome shares >85% homology with a gene probe on the microarray, generally implying that a very similar gene may be present (with the caveat that due to the small size (60 nt) of each microarray probe, false signals may be generated by small sequence differences, giving a level of background ‘noise’ which has to be normalised during data processing). The bottom, horizontal lane of each heatmap is an internal control experiment, and represents the result of hybridising the reference strain DNA for each Group with itself; any bars which lack a yellow colour in these two lanes indicate the position of microarray probes which for technical reasons have failed to hybridise to their cognate DNA sequence. The Group I clades (panel A) do not respect neurotoxin types formed, while the Group II clades (panel B) do respect neurotoxin types formed; i.e. clade 3 = type E, clade 2 = type B or type F, clade 1 = type B strains most closely related to Eklund 17B (hence the greater proportion of yellow bars in these heatmaps). (For interpretation of the references to colour in this figure legend, the reader is referred to the web version of this article.)
Fig. 4
Fig. 4
Dendrogram generated by pairwise comparison of the coding region of C. botulinum Group I neurotoxin gene subtypes A1-A5. Many examples available in GenBank that are identical to subtypes A1 and A2 depicted in this dendrogram have been omitted for clarity. Approximate values for the nucleotide differences used to generate the tree branch points are positioned above the major branches.
Fig. 5
Fig. 5
Dendrogram generated by comparison of neurotoxin genes of C. botulinum Group I type A1. Values for the nucleotide differences used to generate the tree branch points are positioned above the major branches.
Fig. 6
Fig. 6
Dendrogram generated by pairwise comparison of the coding region of C. botulinum Group I and II type B genes. Approximate values for the nucleotide differences used to generate the tree branch points are positioned above the major branches.
Fig. 7
Fig. 7
Dendrogram generated by comparison of neurotoxin genes of C. botulinum Group II subtype B4 (modified from Ref. [57]). The sequence with accession number X71343 was published as being that of Eklund 17B ; however it differs from the two other published versions (which are identical) by 21 nt. Approximate values for the nucleotide differences used to generate the tree branch points are positioned above the major branches.

References

    1. Peck M.W. Clostridium botulinum. In: Juneja V.K., Sofos J.N., editors. Pathogens and toxins in foods: challenges and interventions. ASM Press; Washington DC, USA: 2010. pp. 31–52.
    1. Hatheway C. Botulism. In: Balows A., Hausler W.J., Ohashi M., Turano A., Lennete E.H., editors. Laboratory diagnosis of infectious diseases. Springer; New York: 1988. pp. 111–133.
    1. Johnson E.A. Clostridium botulinum. In: Doyle M.P., Beuchat L.R., editors. Food microbiology: fundamentals and frontiers. 3rd ed. ASM Press; 2007. pp. 401–421.
    1. Peck M.W., Stringer S.C. The safety of pasteurised in-pack chilled meat products with respect to the foodborne botulism hazard. Meat Sci. 2005;70:461–475. - PubMed
    1. Peck M.W., Stringer S.C., Carter A.T. Clostridium botulinum in the post-genomic era. Food Microbiol. 2011;28:183–191. - PubMed

Substances