

Decreased functional connectivity in an executive control network is related to impaired executive function in Internet gaming disorder
- PMID: 25445475
- PMCID: PMC4473260
- DOI: 10.1016/j.pnpbp.2014.10.012
Decreased functional connectivity in an executive control network is related to impaired executive function in Internet gaming disorder
Abstract
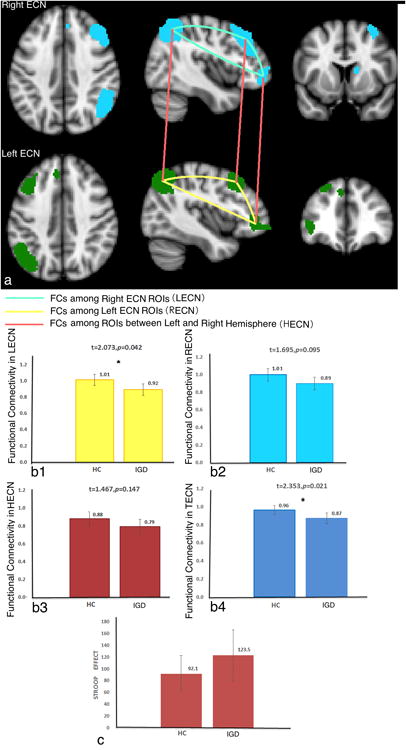
Background: Resting brain spontaneous neural activities across cortical regions have been correlated with specific functional properties in psychiatric groups. Individuals with Internet gaming disorder (IGD) demonstrate impaired executive control. Thus, it is important to examine executive control networks (ECNs) during resting states and their relationships to executive control during task performance.
Methods: Thirty-five IGD and 36 healthy control participants underwent a resting-state fMRI scan and performed a Stroop task inside and outside of the MRI scanner. Correlations between Stroop effect and functional connectivity among ECN regions of interest (ROIs) were calculated within and between groups.
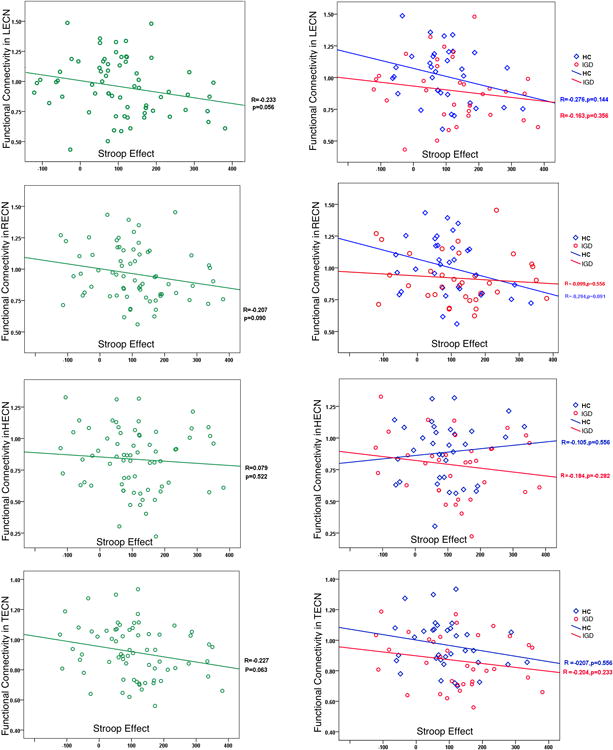
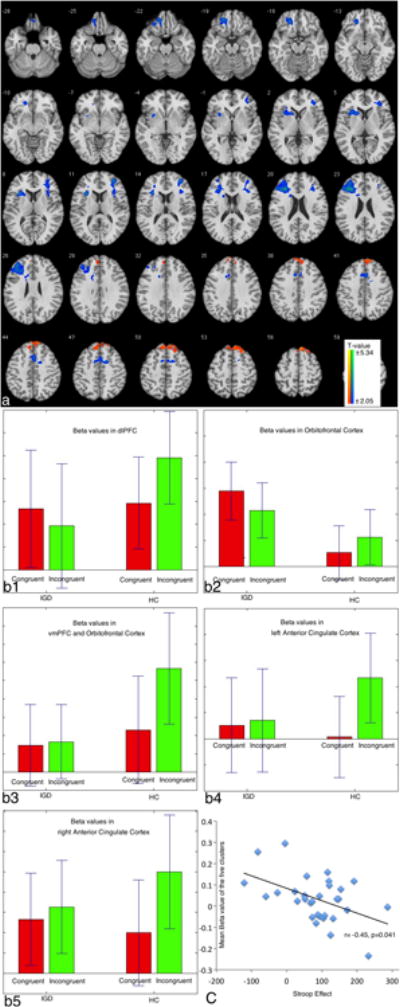
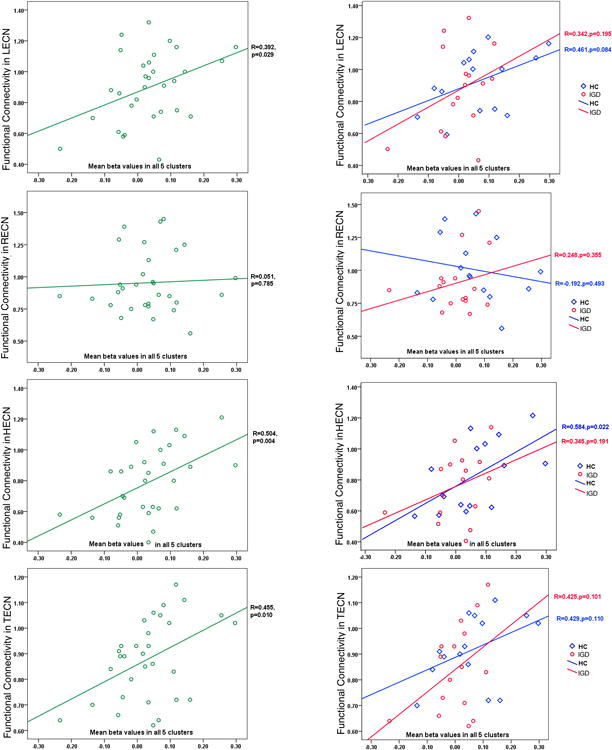
Results: IGD subjects show lower functional connectivity in ECNs than do HC participants during resting state; functional-connectivity measures in ECNs were negatively correlated with Stroop effect and positively correlated with brain activations in executive-control regions across groups. Within groups, negative trends were found between Stroop effect and functional connectivity in ECNs in IGD and HC groups, separately; positive trends were found between functional connectivity in ECNs and brain activations in Stroop task in IGD and HC groups, separately.
Conclusions: Higher functional connectivity in ECNs may underlie better executive control and may provide resilience with respect to IGD. Lower functional connectivity in ECNs may represent an important feature in understanding and treating IGD.
Keywords: Behavioral addiction; Executive control network; Functional connectivity; Internet gaming disorder; Resting state fMRI.
Copyright © 2013 Elsevier Inc. All rights reserved.
Figures
Similar articles
-
Core brain networks interactions and cognitive control in internet gaming disorder individuals in late adolescence/early adulthood.Brain Struct Funct. 2016 Apr;221(3):1427-42. doi: 10.1007/s00429-014-0982-7. Epub 2015 Jan 9. Brain Struct Funct. 2016. PMID: 25573247
-
Frontostriatal circuits, resting state functional connectivity and cognitive control in internet gaming disorder.Addict Biol. 2017 May;22(3):813-822. doi: 10.1111/adb.12348. Epub 2016 Jan 14. Addict Biol. 2017. PMID: 26769234
-
Decreased functional connectivity of insula-based network in young adults with internet gaming disorder.Exp Brain Res. 2016 Sep;234(9):2553-60. doi: 10.1007/s00221-016-4659-8. Epub 2016 Apr 27. Exp Brain Res. 2016. PMID: 27119360
-
The prefrontal dysfunction in individuals with Internet gaming disorder: a meta-analysis of functional magnetic resonance imaging studies.Addict Biol. 2015 Jul;20(4):799-808. doi: 10.1111/adb.12154. Epub 2014 Jun 3. Addict Biol. 2015. PMID: 24889021 Review.
-
Large-scale network dysfunction in youths with Internet gaming disorder: a meta-analysis of resting-state functional connectivity studies.Prog Neuropsychopharmacol Biol Psychiatry. 2021 Jul 13;109:110242. doi: 10.1016/j.pnpbp.2021.110242. Epub 2021 Jan 9. Prog Neuropsychopharmacol Biol Psychiatry. 2021. PMID: 33434637 Review.
Cited by
-
Altered core networks of brain connectivity and personality traits in internet gaming disorder.J Behav Addict. 2020 Apr 1;9(2):298-311. doi: 10.1556/2006.2020.00014. Print 2020 Jun. J Behav Addict. 2020. PMID: 32592635 Free PMC article.
-
Functional Brain Controllability Alterations in Stroke.Front Bioeng Biotechnol. 2022 Jun 27;10:925970. doi: 10.3389/fbioe.2022.925970. eCollection 2022. Front Bioeng Biotechnol. 2022. PMID: 35832411 Free PMC article.
-
Clinical neuropsychiatric considerations regarding nonsubstance or behavioral addictions.Dialogues Clin Neurosci. 2017 Sep;19(3):281-291. doi: 10.31887/DCNS.2017.19.3/mpotenza. Dialogues Clin Neurosci. 2017. PMID: 29302225 Free PMC article. Review.
-
A Cross Sectional and Longitudinal Assessment of Neuropsychiatric Symptoms and Brain Functional Connectivity in Patients With Mild Cognitive Impairment, Cerebrovascular Disease and Parkinson Disease.Int J Geriatr Psychiatry. 2025 Apr;40(4):e70075. doi: 10.1002/gps.70075. Int J Geriatr Psychiatry. 2025. PMID: 40246706 Free PMC article.
-
Effects of Game-Related Tasks for the Diagnosis and Classification of Gaming Disorder.Biosensors (Basel). 2024 Jan 13;14(1):42. doi: 10.3390/bios14010042. Biosensors (Basel). 2024. PMID: 38248419 Free PMC article.
References
-
- American Psychiatric Association. Diagnostic and statistical manual of mental disorders. 5th. Arlington, VA: American Psychiatric Publishing; 2013.
-
- Barros-Loscertales A, Bustamante JC, Ventura-Campos N, Llopis JJ, Parcet MA, Avila C. Lower activation in the right frontoparietal network during a counting Stroop task in a cocaine-dependent group. Psychiatry research. 2011;194:111–118. - PubMed
-
- Beck AT, Ward CH, Mendelson M, Mock J, Erbaugh J. An Inventory for Measuring Depression. Arch Gen Psychiatry. 1961;4:561–571. - PubMed
-
- Block JJ. Issues for DSM-V: internet addiction. The American journal of psychiatry. 2008;165:306–307. - PubMed
Publication types
MeSH terms
Grants and funding
LinkOut - more resources
Full Text Sources
Other Literature Sources
