Review
. 2015 Apr:322:67-76.
doi: 10.1016/j.heares.2014.10.011. Epub 2014 Nov 4.

Assessment of responses to cochlear implant stimulation at different levels of the auditory pathway

Affiliations
Review

Assessment of responses to cochlear implant stimulation at different levels of the auditory pathway

Paul J Abbas et al. Hear Res. 2015 Apr.

Abstract

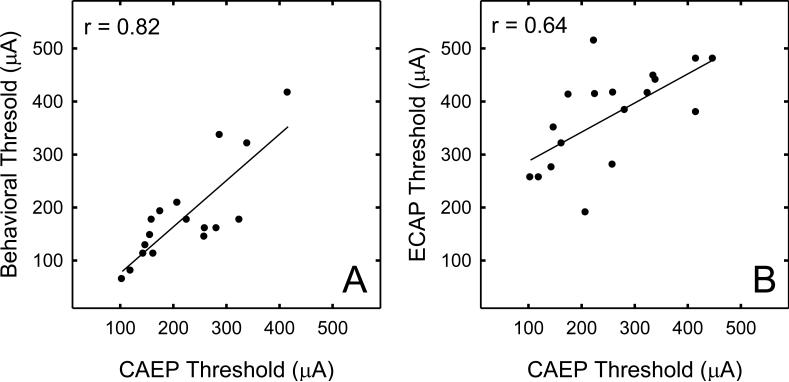
This paper reviews characteristics of both the electrically evoked compound action potential (ECAP) and analogous measures of cortically evoked responses (CAEP) to electrical stimulation in cochlear implant users. Specific comparisons are made between the two levels of processing for measures of threshold, growth of responses with increasing stimulus level, changes in stimulation electrode and, finally, in temporal response properties. The results are interpreted in a context that ECAPs primarily reflect the characteristics of the electrode-neural interface for an individual ear. CAEPs clearly are dependent on those peripheral responses but also reflect differences in central processing among individual implant users. The potential applicability of combined measures in clinical situations is discussed. This article is part of a Special Issue entitled <Lasker Award>.


Figures

Figure 1
Figure 1
Plots of electrically evoked compound action potentials (ECAP) recorded from a Nucleus cochlear implant user. Stimulation is on electrode 18, recording from electrode 19. Level of the probe stimulus is indicated by each waveform.
Figure 2
Figure 2
Recordings of an electrically evoked cortical response (CAEP) to stimulation of electrode 11 in an Advanced Bionics cochlear implant user. Pulse rate of the stimulus was 2017 pps and duration of the pulse train 500 ms. Recordings shown reflect measures obtained using surface electrodes at the vertex(+) relative to contralateral mastoid (−) with forehead ground. Level of the pulse-train stimulus is indicated each waveform. The vertical line indicates stimulus onset and offset. Responses are generally characterized by an initial positive peak (P1), usually small in adults. This is followed by a negative peak at approximately 100 ms after stimulus onset (N1) and a second positive peak (P2). Response amplitude is typically calculated as the difference between N1 and P2.
Figure 3
Figure 3
A. Behavioral threshold is plotted as a function of CAEP threshold for the same stimulus. Both perceptual threshold and CAEP thresholds were measured using a 500-ms pulse train with rate of 2017 pps, and pulse-width 21 us/phase presented on a single electrode. Data are plotted for 13 individuals including both Advanced Bionics and Nucleus implant users and a total of 14 ears. A calculated linear regression line is superimposed on the scatter plot. B. ECAP threshold in response to a single pulse is plotted as a function of CAEP threshold in response to a pulse train. Stimulus for the CAEP was as described in part A. ECAPs were recorded in response to a single biphasic current pulse presented at a 30-80 pps, with pulse width 25 us/phase. Data are plotted for 14 individuals, most of the same subjects as in part A, and a total of 16 ears. A calculated regression line is superimposed on the scatter plot.
Figure 4
Figure 4
Amplitude of response as a function of stimulus level is plotted for both ECAP and CAEP measures in individual CI users. CAEP amplitude is plotted with filled symbols; ECAP is plotted with open symbols. The stimulus for CAEP was a 1000 pps pulse train; the stimulus for ECAP was a single probe pulse, using the normal masker/probe subtraction paradigm (Brown et al., 1990). Each graph represents data from an individual ear. In general, threshold is higher for ECAP and, in contrast to CAEP, and saturation is not evident.
Figure 5
Figure 5
A. Examples of recordings of the auditory change response where the stimulus is a change in the stimulation electrode. For each trace the initial 300 ms was a pulse train on electrode 10. At 300 ms after stimulus onset (change is indicated by the vertical line), the stimulation is changed to a different electrode. The stimulated electrode for the second segment is indicated by each trace. B. Amplitude of the CAEP change response is plotted as a function of the variable electrode where the initial (fixed) electrode was electrode 10. Responses from 12 individuals using the Nucleus implant plotted.
Figure 6
Figure 6
A. Examples of channel interaction functions calculated from ECAP responses recorded from a Nucleus implant user. For each probe electrode, masker electrode is varied, keeping masker level at 10 clinical units below C-level. By subtracting the responses with and without the masker pulse present, the amplitude of response represents a measure of the overlap in stimulation between masker and probe electrodes. Therefore when masker and probe are on the same electrode, the responses tend to be maximum. As masker is separated from the probe, the responses tend to decrease suggesting less overlap. B. This plot illustrates the calculation of channel separation index (CSI, Hughes, 2008) based on the channel interaction functions for probe electrodes 8 and 10 in part A. Each vertical line represents the difference between the functions at each masker electrode. The average of the absolute value of these differences constitutes the CSI. In general, the CSI increases as the separation between to electrodes is increased. For instance, for the data shown in part A, CSI for 8-10 is 0.17, for 8-12 is 0.21 and for 8-14 is 0.29.
Figure 7
Figure 7
An example of ACC amplitude plotted as a function of channel separation index for an individual CI user where each point represents a different separation between stimulating electrodes. This individual is typical of findings in other subjects in that ACC amplitude tends to saturate for electrode pairs showing relatively wide CSI, although the form of the function differs across individuals (See Scheperle & Abbas, submitted, a).
Figure 8
Figure 8
A. Schematic of stimulus used to elicit cortical response to temporal gap. Width of temporal gap is varied. B. CAEP amplitude in response to a gap in a pulse train as a function of gap width. Data are plotted for 8 individual CI users. Increasing gap tends increase amplitude of response but both amplitude and sensitivity differs across individuals.
Figure 9
Figure 9
A. Schematic of stimulus used to elicit ECAP response in a forward masking paradigm. Time interval between masker pulse train offset and probe pulse is varied. B. Amplitude of the ECAP normalized to the amplitude of the ECAP in response to a single pulse is plotted as a function masker-probe interval. Data are plotted from 14 Nucleus cochlear implant users. Recovery functions are averaged across subjects for levels that have relatively low amplitude unadapted responses (<31 [.proportional]V), medium (31-150 [.proportional]V) and high amplitude responses (>150 [.proportional]V). Recovery tends to be nonmonotic, particularly at high stimulus levels, but recovery after the initial 10 ms shows a time course similar to CAEP gap recovery functions in Figure 9B.

References

    1. Abbas PJ, Brown CJ, Etler CP. In: Electrophysiology and Device Telemetry In: Cochlear Implants, 2nd Ed. Waltzman S, Cohen N, editors. Thieme Publ.; New York: 2006.
    1. Abbas PJ, Brown CJ, Shallop JK, Firszt JB, Hughes ML, Hong SH, Staller SJ. Summary of results using the nucleus CI24M implant to record the electrically evoked compound action potential. Ear & Hearing. 1999;1:45–59. - PubMed
    1. Abbas PJ, Hughes ML, Brown CJ, Miller CA, South H. Channel interaction in cochlear implant users evaluated using the electrically evoked compound action potential. Audiol. Neurootol. 2004;4:203–213. - PubMed
    1. Bahmer A, Peter O, Baumann U. Recording and analysis of electrically evoked compound action potentials (ECAPs) with MED-EL cochlear implants and different artifact reduction strategies in Matlab. Journal of Neuroscience Methods. 2010;191:66–74. - PubMed
    1. Berenstein CK, Mens LHM, Mulder JJS, Vanpoucke FJ. Current steering and current focusing in cochlear implants: Comparison of monopolar, tripolar and virtual channel electrode configurations. Ear & Hearing. 2008;2:250–260. - PubMed

Publication types

MeSH terms