. 2015 Feb;27(2):293-305.
doi: 10.1016/j.cellsig.2014.11.013. Epub 2014 Nov 18.

HSP90 inhibitor NVP-AUY922 enhances TRAIL-induced apoptosis by suppressing the JAK2-STAT3-Mcl-1 signal transduction pathway in colorectal cancer cells

Affiliations

HSP90 inhibitor NVP-AUY922 enhances TRAIL-induced apoptosis by suppressing the JAK2-STAT3-Mcl-1 signal transduction pathway in colorectal cancer cells

Dae-Hee Lee et al. Cell Signal. 2015 Feb.

Abstract

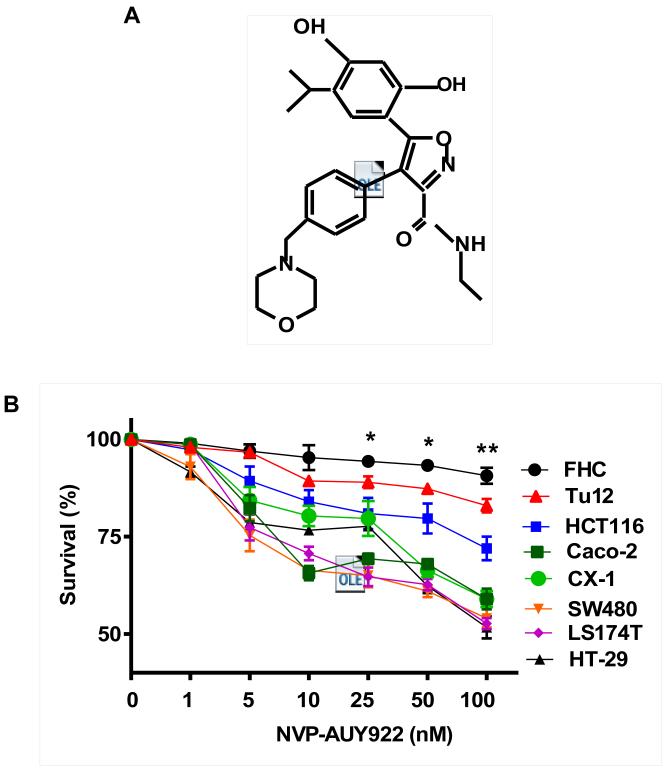
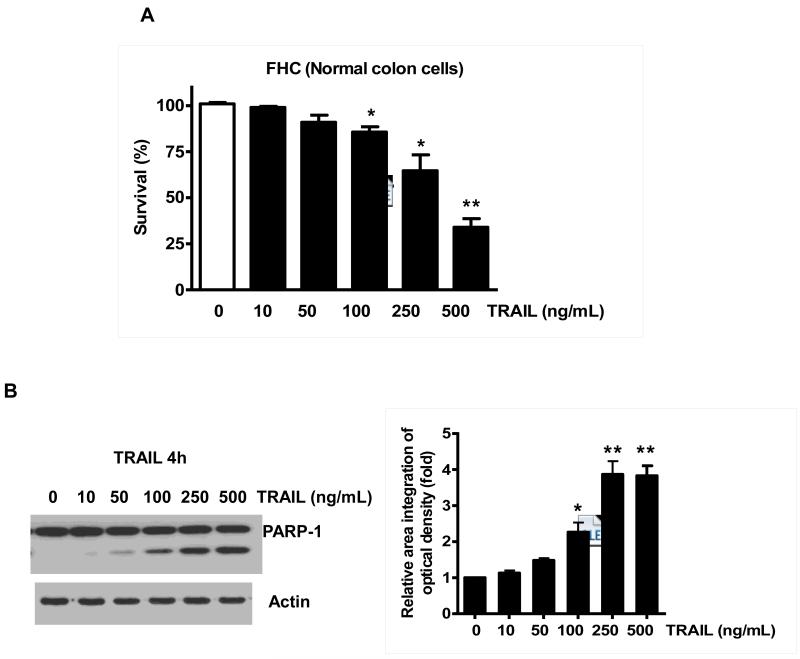
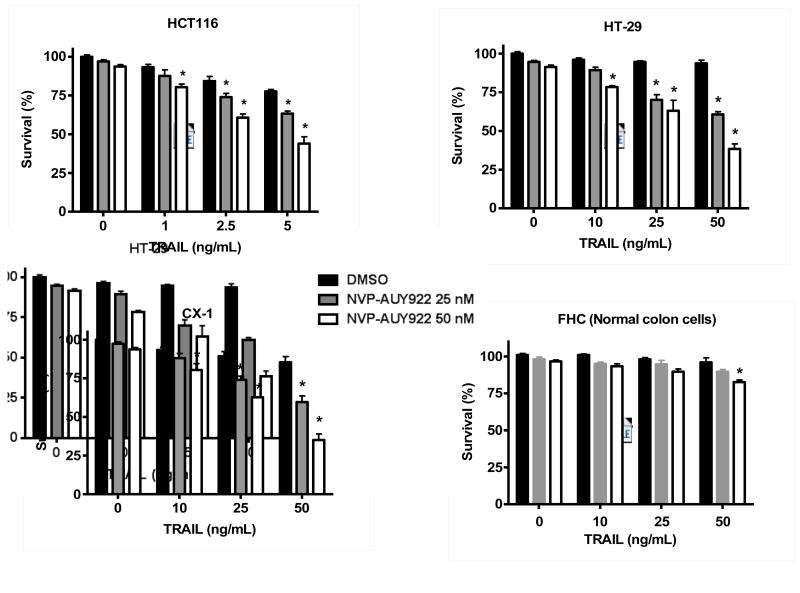
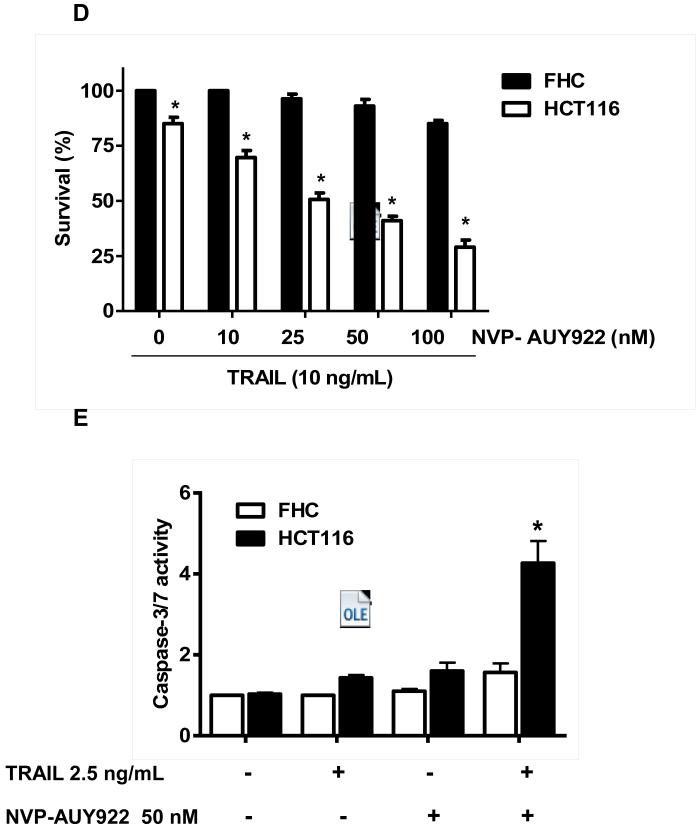
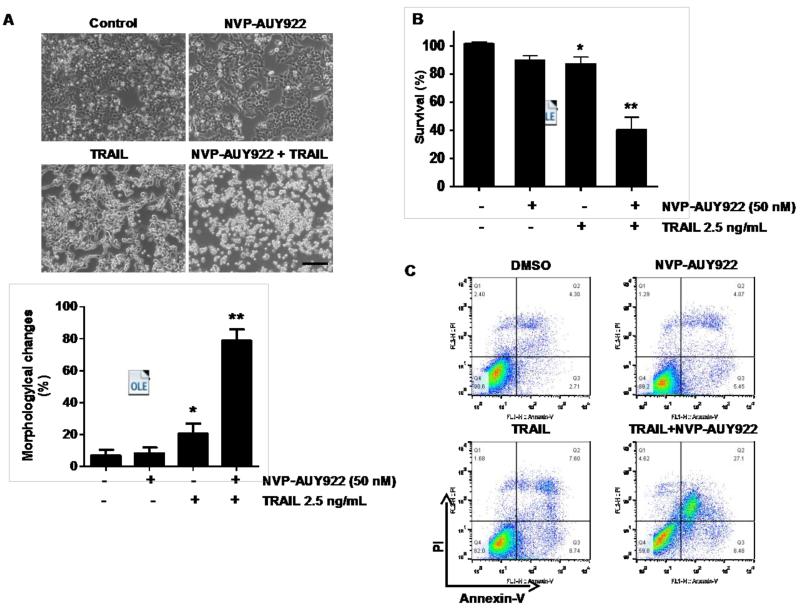
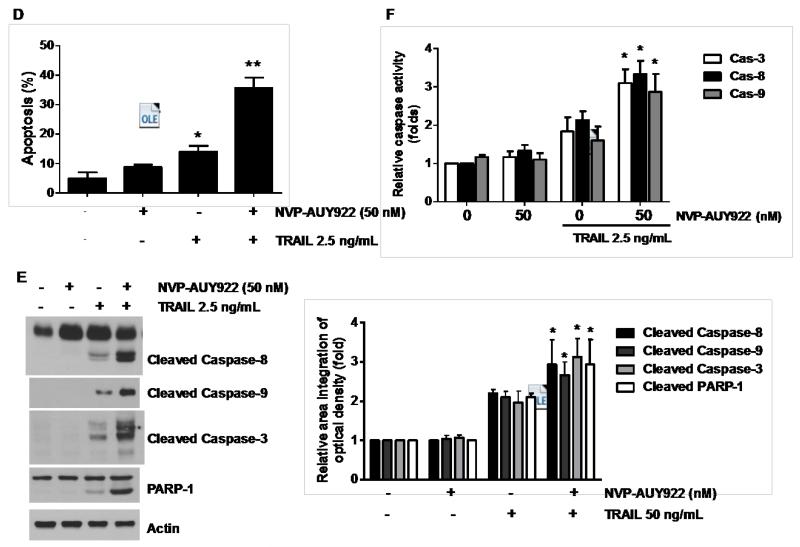
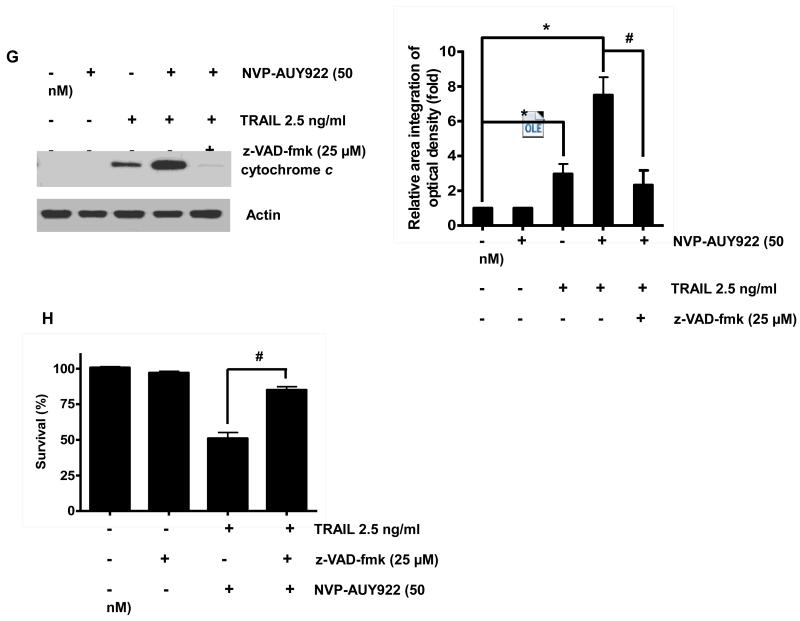
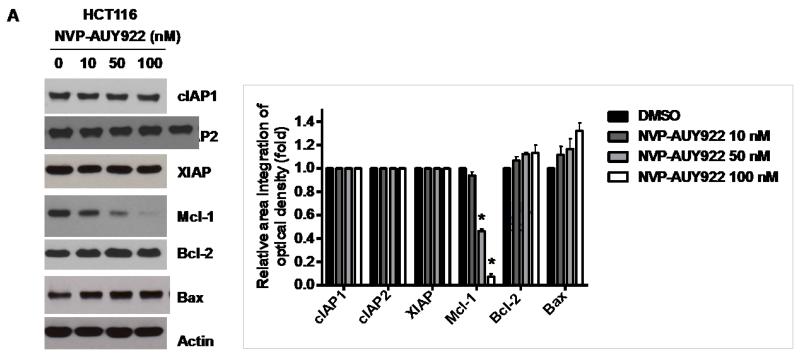
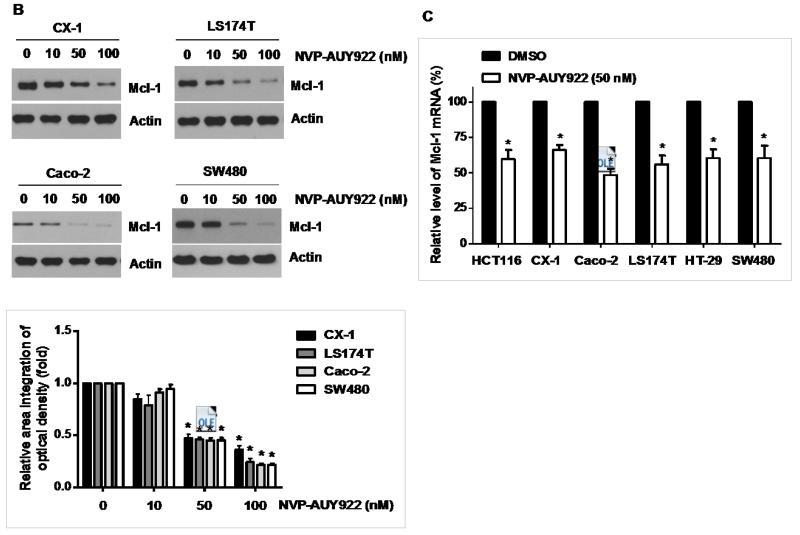
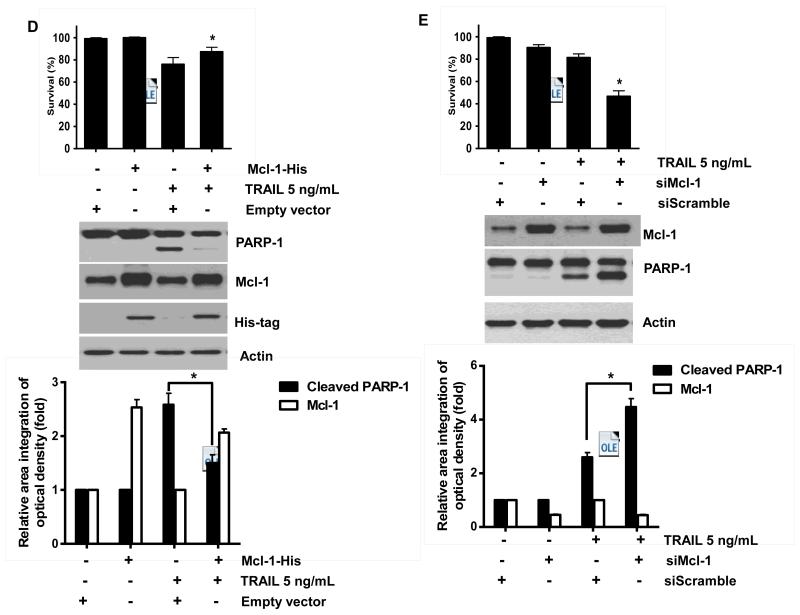
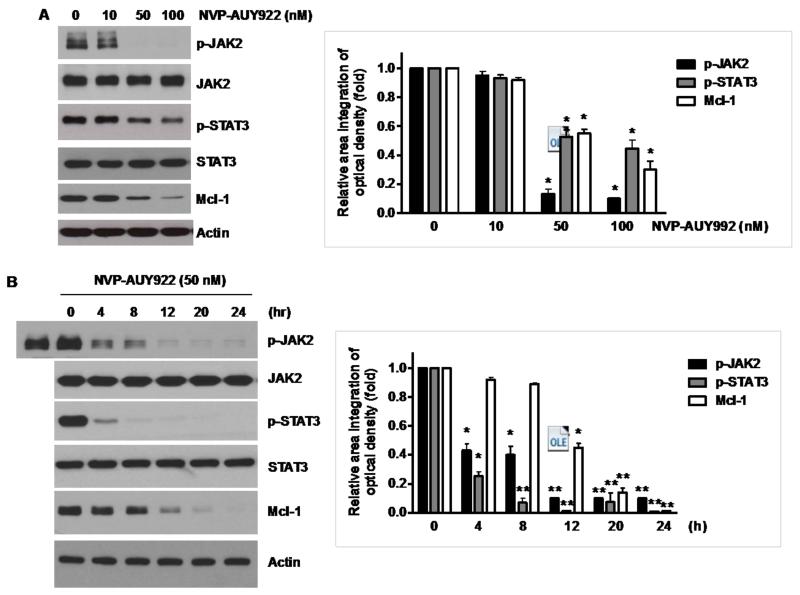
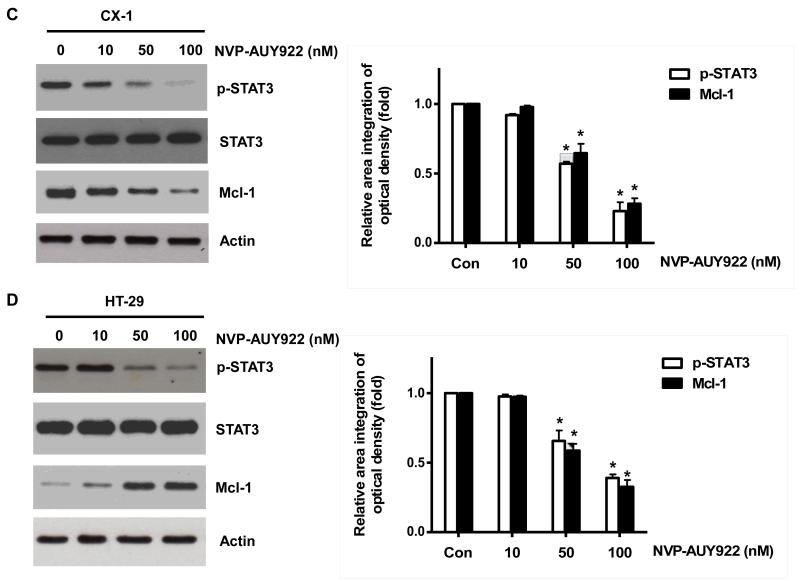
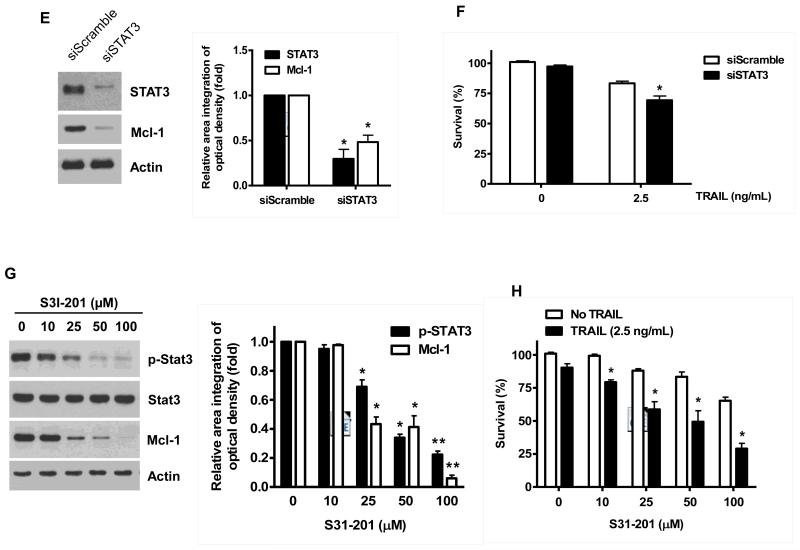
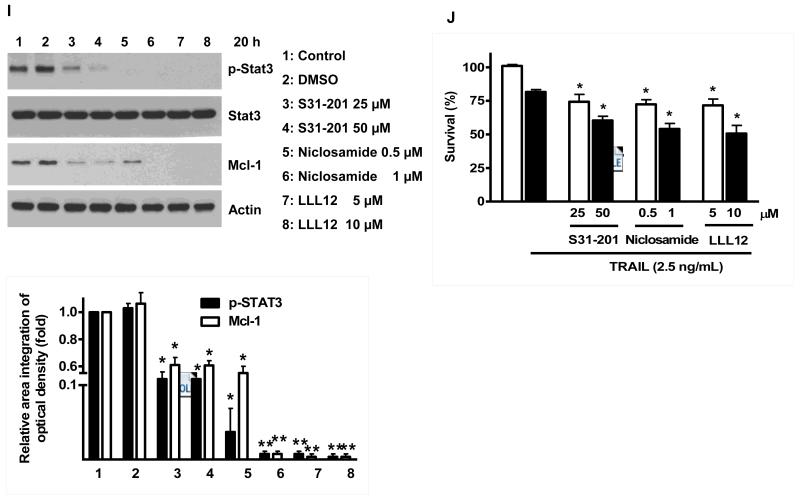
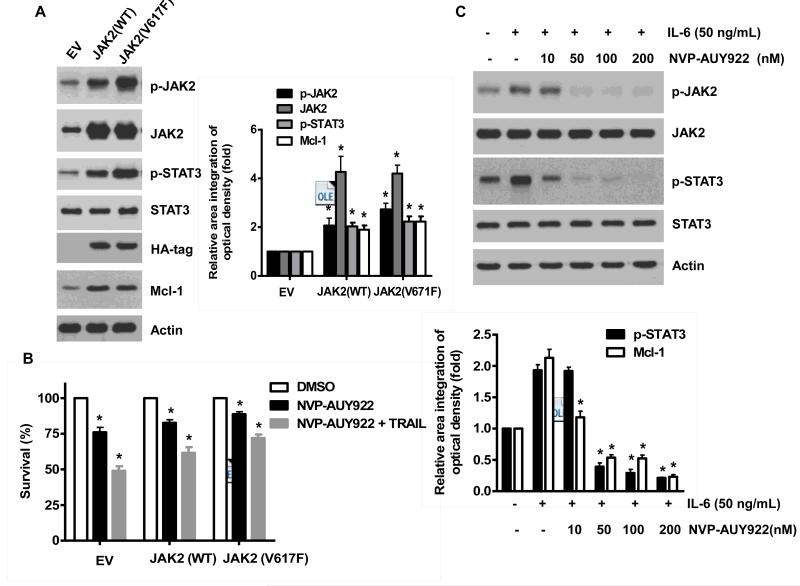
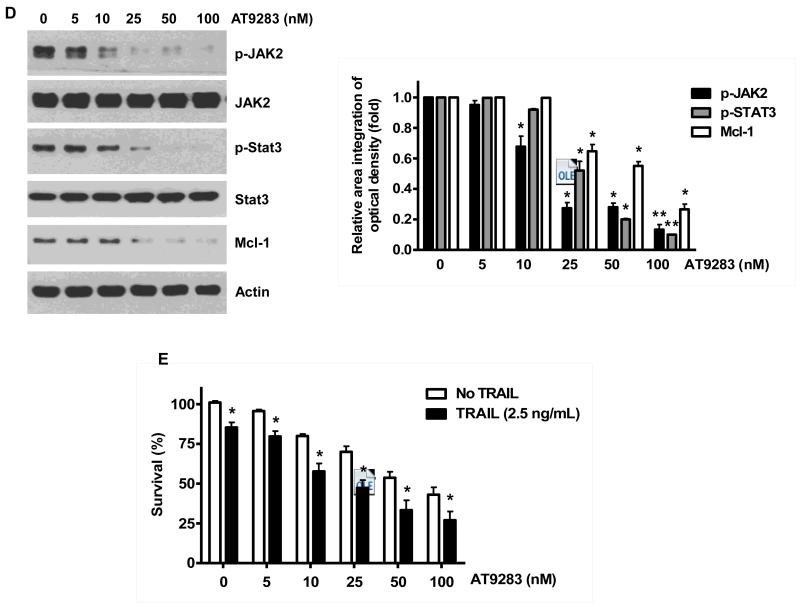
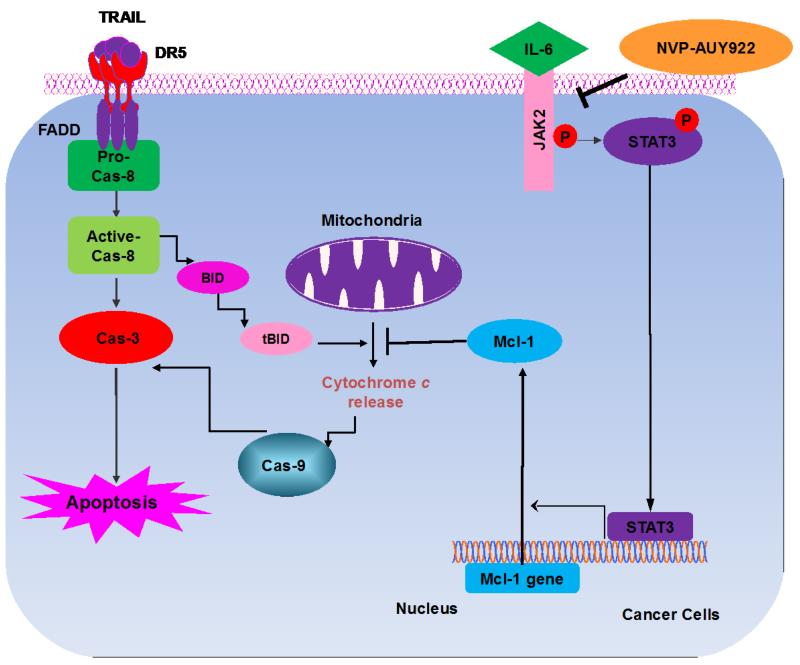
TRAIL has been shown to induce apoptosis in cancer cells, but in some cases, certain cancer cells are resistant to this ligand. In this study, we explored the ability of representative HSP90 (heat shock protein 90) inhibitor NVP-AUY922 to overcome TRAIL resistance by increasing apoptosis in colorectal cancer (CRC) cells. The combination of TRAIL and NVP-AUY922 induced synergistic cytotoxicity and apoptosis, which was mediated through an increase in caspase activation. The treatment of NVP-AUY922 dephosphorylated JAK2 and STAT3 and decreased Mcl-1, which resulted in facilitating cytochrome c release. NVP-AUY922-mediated inhibition of JAK2/STAT3 signaling and down-regulation of their target gene, Mcl-1, occurred in a dose and time-dependent manner. Knock down of Mcl-1, STAT3 inhibitor or JAK2 inhibitor synergistically enhanced TRAIL-induced apoptosis. Taken together, our results suggest the involvement of the JAK2-STAT3-Mcl-1 signal transduction pathway in response to NVP-AUY922 treatment, which may play a key role in NVP-AUY922-mediated sensitization to TRAIL. By contrast, the effect of the combination treatments in non-transformed colon cells was minimal. We provide a clinical rationale that combining HSP90 inhibitor with TRAIL enhances therapeutic efficacy without increasing normal tissue toxicity in CRC patients.

Keywords: Apoptosis; Heat shock protein 90 (HSP90); NVP-AUY922; Tumor necrosis factor (TNF)-related apoptosis-inducing ligand (TRAIL).


Figures

Fig. 1
Fig. 1. NVP-AUY922 induces cytotoxicity in human colon cancer cells
(A) The structure of NVP-AUY922. (B) Cells were treated with various concentrations of NVP-AUY922 (1–100 nM) for 20 hr before being subject to the MTS assay. Error bars represent standard error of the mean (SEM) from three separate experiments. Some error bars are too small to be seen. Asterisk * or ** represents a statistically significant difference between FHC and cancer cells at p<0.05 or p<0.01, respectively.
Fig. 2
Fig. 2. NVP-AUY922 markedly sensitizes various human colon cancer cells, but not normal colon cells, to TRAIL-induced apoptosis
(A and B) FHC cells were treated with various concentrations (1-500 ng/ml) of TRAIL for 4 hr. (A) Cytotoxic effect of TRAIL was determined using the MTS assay. Error bars represent standard error of the mean (SEM) from three separate experiments. Asterisk * or ** represents a statistically significant difference between TRAIL treated FTC cells and untreated FTC cells at p<0.05 or p<0.01, respectively. (B) Equal amounts of protein (20 μg) from cell lysates were separated by SDS-PAGE and immunoblotted with anti-PARP-1. Actin was shown as an internal standard. Densitometry analysis of the bands from the cleaved form of PARP-1 was performed (right panel). Error bars represent standard error of the mean (SEM) from three separate experiments. Asterisk * or ** represents a statistically significant difference between TRAIL treated FTC cells and untreated FTC cells at p<0.05 or p<0.01, respectively. (C) Three different human colon cancer cells (HCT116, HT-29 and CX-1) and normal colon FHC cells were untreated or pretreated with NVP-AUY922 for 20 hr and then treated with TRAIL for 4 hr at the indicated concentration. Cellular viability was assessed using MTS assay. Error bars represent standard error of the mean (SEM) from three separate experiments. Asterisk * represents a statistically significant difference between NVP-AUY922 treated cells and untreated cells at p<0.05. (D) HCT116 and FHC cells were treated with various concentrations (0-100 nM) of NVP-AUY922 for 20 hr, and then added TRAIL for 4 hr. Cellular viability was assessed using MTS assay. Error bars represent standard error of the mean (SEM) from three separate experiments. Asterisk * represents a statistically significant difference between FHC cells and HCT116 cells at p<0.05. (E) HCT116 cells treated with 50 nM NVP-AUY922 alone (24 hr), 2.5 ng/ml TRAIL alone (4 hr), or NVP-AUY922 (20 hr) + TRAIL (4 h) for 24 h. Relative caspase activity was determined by the manufacturer’s protocol. Columns indicate average of three individual experiments; bars represents ±SD; *p < 0.05, compared with TRAIL-treated cells.
Fig. 3
Fig. 3. Sensitizing effect of NVP-AUY922 on TRAIL-induced apoptosis in HCT116 cells
(A-F) Cells were treated with DMSO (sham control), 50 nM NVP-AUY922 only for 24 hr, or 50 nM NVP-AUY922 only for 20 hr and then incubated in the presence or absence of TRAIL (2.5 ng/ml) for 4 hr. (A) Microscopic cell morphologies. Scale bar: 100 μm. Morphologically changed cells were counted and analyzed. Error bars represent standard error of the mean (SEM) from three separate experiments. Asterisk * or ** represents a statistically significant difference between treated cells and untreated control cells at p<0.05 or p<0.01, respectively. (B) Cellular viability was assessed using MTS assay. Error bars represent standard error of the mean (SEM) from three separate experiments. Asterisk * or ** represents a statistically significant difference between treated cells and untreated control cells at p<0.05 or p<0.01, respectively. (C and D) The cells were stained with annexin V and propidium iodide (PI), followed by FACS analysis. Error bars represent standard error of the mean (SEM) from three separate experiments. Asterisk * or ** represents a statistically significant difference between treated cells and untreated control cells at p<0.05 or p<0.01, respectively. (E) Lysates containing equal amounts of protein (20 μg) were separated by SDS–PAGE and immunoblotted with anti-PARP-1, anti-caspase-8, anti-caspase-9, or anti-caspase-3 antibody. Densitometry analysis of the bands from the cleaved forms of caspase-8, -9, -3 or PARP-1 was performed (right panel). Error bars represent standard error of the mean (SEM) from three separate experiments. Asterisk * represents a statistically significant difference between treated cells and untreated control cells at p<0.01. (F) Relative caspase activity was determined by the manufacturer’s protocol. Error bars represent standard error of the mean (SEM) from three separate experiments. Asterisk * represents a statistically significant difference between NVP-AUP922 + TRAIL treated cells and TRAIL alone treated cells at p<0.05. (G and H) Cells were pretreated with 25 μM z-VAD-fmk for 30 min and further treated with NVP-AUY922 (20 hr) + TRAIL (4 hr) for 24 hr. (G) Lysates from cytosolic fractions containing equal amounts of protein (20 μg) were separated by SDS–PAGE and immunoblotted with anti-cytochrome c antibody. Actin was used to confirm the equal amount of proteins loaded in each lane. Densitometry analysis of the bands from the cytochrome c was performed (right panel). Error bars represent standard error of the mean (SEM) from three separate experiments. Asterisk * represents a statistically significant difference between NVP-AUY922/TRAIL treated cells and untreated control cells at p<0.01. Hashtag # represents a statistically significant difference between z-VAD-fmk + NVP-AUY922 + TRAIL treated cells and NVP-AUY922 + TRAIL treated cells at p<0.01. (H) Cellular viability was assessed using an MTS assay. Error bars represent standard error of the mean (SEM) from three separate experiments. Hashtag # represents a statistically significant difference between z-VAD-fmk + NVP-AUY922 + TRAIL treated cells and NVP-AUY922 + TRAIL treated cells at p<0.01.
Fig. 4
Fig. 4. Role of Mcl-1 in the sensitizing function of NVP-AUY922
(A) HCT116 cells were treated with indicated NVP-AUY922 doses (0, 10, 50, 100 nM) for 20 hr. Western blotting analysis was done by using indicated antibodies (cIAP1, cIAP2, XIAP, Mcl-1, Bcl-2, and Bax). Densitometry analysis of the bands from each protein was performed (right panel). Error bars represent standard error of the mean (SEM) from three separate experiments. Asterisk * represents a statistically significant difference between NVP-AUY922 treated cells and untreated control cells at p<0.01. (B) CX-1, LS174T, Caco-2, and SW480 cells were treated with indicated NVP-AUY922 doses (0, 10, 50, 100 nM) for 20 hr. Cell lysates were analyzed by western blotting using anti-Mcl-1 antibody. Densitometry analysis of the bands from Mcl-1 was performed (lower panel). Error bars represent standard error of the mean (SEM) from three separate experiments. Asterisk * represents a statistically significant difference between NVP-AUY922 treated cells and untreated control cells at p<0.05. (C) Various colon cancer cells were treated with 50 nM NVP-AUY922 for 20 hr. Mcl-1 mRNA expression was determined by RT-PCR. Error bars represent standard error of the mean (SEM) from three separate experiments. Asterisk * represents a statistically significant difference between NVP-AUY922 treated cells and untreated control cells at p<0.05. (D) Empty vector (control) or Mcl-1 stably over-expressing HCT116 cells (lower panel) were treated with TRAIL for 4 hr. Survival was analyzed by MTS assay (upper panel). Densitometry analysis of the bands from cleaved PARP-1 or Mcl-1 was performed (lower panel). Error bars represent standard error of the mean (SEM) from three separate experiments. Asterisk * represents a statistically significant difference between TRAIL treated on empty vector transfected cells and TRAIL treated on Mcl-1-His vector transfected cells at p<0.05. (E) Mcl-1 was silenced by Mcl-1 siRNA in HCT116 cells (lower panel). The cells were then treated with TRAIL for 4 hr followed by MTS analysis (upper panel). Results shown are representative of three independent experiments. Densitometry analysis of the bands from cleaved PARP-1 or Mcl-1 was performed (lowest panel). Error bars represent standard error of the mean (SEM) from three separate experiments. Asterisk * represents a statistically significant difference between TRAIL + siScramble treated cells and TRAIL + siMcl-1 treated cells at p<0.05.
Fig. 5
Fig. 5. Effects of NVP-AUY922 on the JAK2-STAT3-Mcl-1 pathway
(A and B) (A) HCT116 cells were treated with indicated NVP-AUY922 doses (0, 10, 50, 100 nM) for 20 hr. Densitometry analysis of the bands from p-JAK2, p-STAT3 or Mcl-1 was performed (right panel). Error bars represent standard error of the mean (SEM) from three separate experiments. Asterisk * represents a statistically significant difference between NVP-AUY992 treated cells and untreated control cells at p<0.05. (B) HCT116 cells were treated with 50 nM NVP-AUY922 for various times (4-24 hr). Lysates containing equal amounts of protein (20 μg) were separated by SDS-PAGE and immunoblotted with anti-phospho-JAK2, anti-JAK2, anti-phospho-STAT3, anti-STAT3, or anti-Mcl-1 antibody. Actin was shown as an internal standard. Densitometry analysis of the bands from p-JAK2, p-STAT3 or Mcl-1 was performed (right panel). Error bars represent standard error of the mean (SEM) from three separate experiments. Asterisk * represents a statistically significant difference between NVP-AUY992 treated cells and untreated control cells at p<0.05. (C and D) CX-1 and HT-29 cells were treated with indicated NVP-AUY922 doses (0, 10, 50, 100 nM) for 20 hr followed by western blotting using anti-phospho-STAT3, anti-STAT3, or anti-Mcl-1 antibody (left panels). Actin was shown as an internal standard. Densitometry analysis of the bands from p-STAT3 or Mcl-1 was performed (right panels). Error bars represent standard error of the mean (SEM) from three separate experiments. Asterisk * represents a statistically significant difference between NVP-AUY992 treated cells and untreated control cells at p<0.05. (E and F) STAT3 was silenced by STAT3 siRNA in HCT116 cells. The cells were then treated with TRAIL for 4 hr followed by MTS analysis. Densitometry analysis of the bands from STAT3 or Mcl-1 was performed (right panel). Error bars represent standard error of the mean (SEM) from three separate experiments. Asterisk * represents a statistically significant difference between siSTAT3 treated cells and siControl treated cells at p<0.05. (G and H) HCT116 cells were treated with various concentrations of S31-201 (10, 25, 50, 100 μM) for 20 hr, and then added TRAIL for 4 hr. Lysates containing equal amounts of protein were separated by SDS-PAGE and immunoblotted with anti-phospho-STAT3, anti-STAT3, or anti-Mcl-1 antibody. Actin was shown as an internal standard. Three independent experiments were carried out and cellular viability was assessed using an MTS assay. Densitometry analysis of the bands from p-STAT3 or Mcl-1 was performed (right panel). Error bars represent standard error of the mean (SEM) from three separate experiments. Asterisk * or ** represents a statistically significant difference between treated cells and untreated control cells at p<0.05 or p<0.01, respectively. (I and J) HCT116 cells were treated with S31-201 (25, 50 μM), niclosamide (0.5, 1 μM) or LLL12 (5, 10 μM) for 20 hr, and then added TRAIL for 4 hr. Three independent experiments were carried out and cellular viability was assessed using an MTS assay. Densitometry analysis of the bands from p-STAT3 or Mcl-1 was performed (lower panel). Error bars represent standard error of the mean (SEM) from three separate experiments. Asterisk * represents a statistically significant difference between control and drug treated cells at p<0.05.
Fig. 6
Fig. 6. NVP-AUY922 inhibits the IL-6-JAK2-STAT3-Mcl-1 pathway in HCT116 cells
(A and B) Cells were transfected with empty vector (EV), HA-JAK2-WT or HA-JAK2-V617F. (A) Lysates containing equal amounts of protein were separated by SDS-PAGE and immunoblotted with anti-phospho-JAK2, anti-JAK2, anti-phospho-STAT3, anti-STAT3, anti-HA (exogenous JAK), or anti-Mcl-1 antibody. Actin was shown as an internal standard. Densitometry analysis of the bands from p-JAK2, JAK2, p-STAT3 or Mcl-1 was performed (right panel). Error bars represent standard error of the mean (SEM) from three separate experiments. Asterisk * represents a statistically significant difference between JAK2 WT or JAK2 V617F vector transfected cells and empty vector transfected cells at p<0.05. (B) Transfected cells were treated with TRAIL for 4 hr and cellular viability was assessed using an MTS assay. Error bars represent the mean + S.E from three separate experiments. Asterisk * represents a statistically significant difference between NVP-AUY922 or NVP-AUY922 + TRAIL treated cells and untreated control cells at p<0.05. (C) Cells were pretreated with 50 ng IL-6 for 30 min and further treated with NVP-AUY922 for 4 hr. Lysates containing equal amounts of protein were separated by SDS-PAGE and immunoblotted with anti-phospho-JAK2, anti-JAK2, anti-phospho-STAT3, or anti-STAT3 antibody. Actin was shown as an internal standard. Densitometry analysis of the bands from p-STAT3 or Mcl-1 was performed (lower panel). Error bars represent standard error of the mean (SEM) from three separate experiments. Asterisk * represents a statistically significant difference between IL-6 + NVP-AUY922 treated cells and IL-6 alone treated cells at p<0.05. ((D and E) Cells were treated with AT9283 (5, 10, 25, 50, 100 nM) for 20 hr, and then added TRAIL for 4 hr. (D) Lysates containing equal amounts of protein were separated by SDS-PAGE and immunoblotted with anti-phospho-JAK2, anti-JAK2, anti-phospho-STAT3, anti-STAT3, or anti-Mcl-1 antibody. Actin was shown as an internal standard. Densitometry analysis of the bands from p-JAK2, p-STAT3 or Mcl-1 was performed (right panel). Error bars represent standard error of the mean (SEM) from three separate experiments. Asterisk * represents a statistically significant difference between drug treated cells and untreated control cells at p<0.05. (E) Cellular viability was assessed using an MTS assay. Error bars represent the mean + S.E from three separate experiments. Asterisk * represents a statistically significant difference between control and drug treated cells at p<0.05.
Figure 7
Figure 7. Schematic diagram for working model of NVP-AUY922 sensitizing TRAIL-induced apoptosis

Similar articles

Cited by

References

    1. Acheson AG, Scholefield JH. British journal of cancer. 2008;99(Suppl 1):S33–34. - PMC - PubMed
    1. Miura K, Satoh M, Kinouchi M, Yamamoto K, Hasegawa Y, Philchenkov A, Kakugawa Y, Fujiya T. Expert opinion on drug discovery. 2014;9:1087–1101. - PubMed
    1. Ashkenazi A, Pai RC, Fong S, Leung S, Lawrence DA, Marsters SA, Blackie C, Chang L, McMurtrey AE, Hebert A, DeForge L, Koumenis IL, Lewis D, Harris L, Bussiere J, Koeppen H, Shahrokh Z, Schwall RH. The Journal of clinical investigation. 1999;104:155–162. - PMC - PubMed
    1. Walczak H, Miller RE, Ariail K, Gliniak B, Griffith TS, Kubin M, Chin W, Jones J, Woodward A, Le T, Smith C, Smolak P, Goodwin RG, Rauch CT, Schuh JC, Lynch DH. Nature medicine. 1999;5:157–163. - PubMed
    1. Wiley SR, Schooley K, Smolak PJ, Din WS, Huang CP, Nicholl JK, Sutherland GR, Smith TD, Rauch C, Smith CA, et al. Immunity. 1995;3:673–682. - PubMed

Publication types

MeSH terms

Substances

LinkOut - more resources