. 2014 Nov 10;31(3):279-290.
doi: 10.1016/j.devcel.2014.09.011. Epub 2014 Oct 30.

IFT27 links the BBSome to IFT for maintenance of the ciliary signaling compartment

Affiliations

IFT27 links the BBSome to IFT for maintenance of the ciliary signaling compartment

Thibaut Eguether et al. Dev Cell. .

Abstract

Vertebrate hedgehog signaling is coordinated by the differential localization of the receptors patched-1 and Smoothened in the primary cilium. Cilia assembly is mediated by intraflagellar transport (IFT), and cilia defects disrupt hedgehog signaling, causing many structural birth defects. We generated Ift25 and Ift27 knockout mice and show that they have structural birth defects indicative of hedgehog signaling dysfunction. Surprisingly, ciliary assembly is not affected, but abnormal hedgehog signaling is observed in conjunction with ciliary accumulation of patched-1 and Smoothened. Similarly, Smoothened accumulates in cilia on cells mutated for BBSome components or the BBS binding protein/regulator Lztfl1. Interestingly, the BBSome and Lztfl1 accumulate to high levels in Ift27 mutant cilia. Because Lztfl1 mutant cells accumulate BBSome but not IFT27, it is likely that Lztfl1 functions downstream of IFT27 to couple the BBSome to the IFT particle for coordinated removal of patched-1 and Smoothened from cilia during hedgehog signaling.


Figures

Figure 1
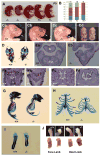
Figure 1. Ift27 null mutants display multiple developmental defects
A. Images of P0 animals. Ift27null1 genotypes are given below. All animals were alive when photographed. B. Genotype distribution at the day prior to birth (E18), day of birth (P0) and later (>P0) in offspring of Ift27null1/+ by Ift27null1/+ crosses. Blue, orange and green represent +/+, +/- and -/- genotypes respectively. Homozygous mutant animals were alive on the day prior to birth but died on P0 so the P0 numbers reflect a mix of live and dead animals. C. Images of embryos at E18.5 (Ca, Cb, Cc) and E15.5 (Cd). Note abnormal facial structure, abnormal lower jaw (arrow) and more closely spaced eyes (hypotelorism). D. Alcian blue and alizarin red staining of the skull shows abnormal palate development. E. H&E stained frontal sections of the oral cavity. The mutant lacks the body of the mandible (md) and the tongue (to). F. H&E stained sections of nasal cavities of E15.5 (Fa, Fb) and E18.5 (Fc, Fd) embryos. The mutant embryos in each case show under-developed nasal structures, particularly the inferior regions including the vomer bone of the nasal septum (ns), although superior cartilaginous parts of the septum appear to develop normally. 1p, primary palate; 2p, secondary palate; ui, upper incisor; vno, vomeronasal organ. Scale bars = 200 μm. G, H. Alcian blue and alizarin red staining of the skeleton shows abnormal skull shape, curvature of the spine and abnormal rib cage including malaligned sternal vertebrate. I, J. Alcian blue and alizarin red stained (I) and unstained (J) images of limbs showing a variety of digit defects.
Figure 2
Figure 2. Ift27 mutants have structural heart and lung disease
A. Lung isomerism. H&E images show the normal arrangement of 4 right lobes and 1 left lobe in the control animals (Aa, Ac). Mutants (Ab, Ad) have a single lobe on both sides indicating a left isomerism. Note the large open sac (TEF balloon) within the thoracic cavity that projects through the diaphragm and connects to the stomach (St). Lg, lung; Lv, liver; Ht, heart. Scale bars are 500 μm. The * marks a crack in the tissue that occurred during processing. B. Immunofluorescence images of the epithelium lining the TEF balloon (IFT88 green, 6-11B-1 red, DAPI blue). A section adjacent to the one imaged in Ad was stained and the approximate position of the imaged region is marked by an arrow in Ad. Likewise the arrow in Ba marks the cell that was imaged in Bb. Scale bar in Ba is 50 μm and 10 μm in Bb. Ba and Bb are maximum projections of a 16 and 10 layer Z-stacks acquired every 0.5 μm. C. Surface renderings of ECM image stacks show heart placement defects. The apex of the heart normally points towards the left side of the thoracic cavity (levocardia). Heart orientation in Ift27 mutants is variable with 11/14 showing levocardia, 1/14 mesocardia (apex at midline) and 2/14 dextrocardia (apex pointed to the right side). D. ECM imaging reveals structural heart defects in Ift27 mutants. Images shown are single planes of reconstructed hearts taken at levels to highlight the ventricular septum (top row) or atrial septum (bottom row). Movies of these 3D reconstructions and additional planes are included in the supplementary material. Left panel is a control heart while the right two panels are from mutants illustrating either partial (middle) or complete (right) atrioventricular septal defects. CA, Common atrium; VSD, ventricular septal defect; AVSD, atrioventricular septal defect; Ao, aorta; dAo, descending aorta; PT, pulmonary trunk; PA, pulmonary artery; LSVC, left superior vena cava; RSVC, right superior vena cava; LA, left atrium; RA, right atrium; LV, left ventricle; RV, right ventricle; TEF, tracheoesophageal fistula; T, trachea; O, esophagus.
Figure 3
Figure 3. Ift27 is not required for ciliation
A. Effect of the Ift27null1 mutation on IFT protein stability. Protein extracts from wild-type and mutant MEFs were immunoblotted with the antibodies indicated on the right side of each western blot panel. Approximate molecular weights are listed on the left side. Quantitation of IFT protein levels relative to γ-tubulin loading control are listed on the right side of each western blot (n=3 embryos/MEF lines per genotype) (*p<0.05, **p<0.01). B. E18.5 lung and kidney sections from Ift27+/+ and Ift27null1/null1 mice immunostained with IFT88 (green) and the acetylated tubulin cilia marker 6-11B-1 (red). Scale bar is 5μm and applies to all images. Images are maximum projections of 10 layer Z-stacks acquired every 0.5 μm C. Immunofluorescence of control and mutant MEFs immunostained with 6-11B-1 (cilia, red) and IFT27, IFT88, IFT140 or Dync2h1 (green). Note the lack of IFT27 staining of mutant cells (25/25 wild type cells and 0/25 mutant cells showed IFT27 staining). Staining of cilia for the other antibodies were similar in both mutant and control cells (25/25 cells positive for each condition). D. Quantitation of ciliation and ciliary length in MEF cells. Percentage of ciliated cells and ciliary lengths based on ciliary IFT88 immunostaining in serum starved MEFs (n=3 Ift27+/+ and 3 Ift27null1/null1 embryos/MEF lines for % ciliation and n=50 cilia per cell line for length). Differences for percent ciliation were not significantly different, but mutant cilia were slightly longer (** p<0.01). E. IFT25-Flag (green) localizes to cilia (6-11B-1, red) in wild type cells but not Ift27null1/null1 cells. Inset shows green (IFT25-Flag) channel. Quantification showed 23/25 transfected wild type cells had ciliary-localized IFT25-Flag while 0/25 transfected mutant cells had ciliary-localized IFT25-Flag. F, G. Interaction between IFT25 and IFT27 are required for IFT25 to enter cilia. F. Immunoprecipitation from IMCD3 cells transfected with Flag-GST, Flag-IFT25 or Flag-IFT25(T40R/T42R/S128E) demonstrate that wild type but not the mutant form of IFT25 bind to IFT27 and IFT88. G. In IMCD3 cells, wild type Flag-IFT25 (Flag, red) localizes to cilia (IFT88, green) but Flag-IFT25(T40R/T42R/S128E) (Flag, red) does not. Quantification showed that 0/50 Flag-GST, 47/50 Flag-IFT25, 0/50 Flag-IFT25(T40R/T42R/S128E) transfected cells had Flag-positive cilia. Scale bar is 5 μm and applies to all images in G. H. Wild type Flag-IFT25 (top row, Flag, red) but not Flag-IFT25(T40R/T42R/S128E) (bottom row, Flag, red) rescues the BBS9 (left panel, green) and Smo (right panel green) accumulation phenotypes in Ift25null1/null1 mutant MEFs. Arrows mark cilia on transfected cells which are shown in the insets with separate red and green channels. Quantification showed 25/25 cells transfected with wild type IFT25 showed rescue of the accumulation of ciliary BBS9 and Smo phenotypes while 0/25 transfected with IFT25(T40R/T42R/S128E) showed rescue. The * marks a cilium on a non-transfected cell. Scale bar is 5 μm and applies to all images in H. I. Immunoprecipitation from MEF cells transfected with IFT27-Flag, IFT27(K68L)-Flag, IFT27(T19N)-Flag or Flag-GST demonstrate that all forms of IFT27 bind to IFT25 but only wild type and the K68L forms of IFT27 bind to IFT88. No binding between any form of IFT27 and IFT140 was detected. Note that with this exposure time, IFT88 is not detectable until after immunoprecipitation. J. Wild type IFT27-Flag (left column, Flag, red), IFT27(K68L)-Flag (middle column, Flag, red) and Flag-IFT27(T19N) (right column, Flag, red) expressed in Ift27+/+ (top row) and Ift27null1/null1 (bottom row) MEFs. Quantification showed that, 80/100 IFT27-Flag, 24/100 IFT27(K68L)-Flag and 0/100 IFT27(T19N)-Flag transfected Ift27+/+ cells had Flag-positive cilia while 72/100 IFT27-Flag, 86/100 IFT27(K68L)-Flag and 36/100 IFT27(T19N)-Flag transfected Ift27null1/null1 cells had Flag-positive cilia. Scale bar is 5 μm and applies to all images in J.
Figure 4
Figure 4. IFT27 is required for normal Hedgehog signaling
A-C. Ift27+/+ and Ift27null1/null1 MEFs were left untreated or treated with SAG, a Shh pathway activator. Cell lines from three different embryos were used for each genotype. A. RNA was isolated from one set of cells and analyzed for gene expression by quantitative real time PCR (left column). Proteins were isolated from another set of cells and analyzed by western blotting. Quantitation of protein levels are listed on the right side of each western blot and compared to γ-tubulin loading control. Groups were compared by ANOVA; only comparisons between SAG treated control and mutant cells are depicted in this figure (**p=<0.01 and ***p=<0.001) but other comparisons are in Supplemental Table 4. Full length (FL) and repressor (R) form of Gli3 protein were analyzed separately. B, C, D. Cells were fixed and stained for cilia (arrows, 6-11B-1, red) and Smo (green, B), Gpr161 (green C) or Gli2 (green, D). Insets show the green channel (Smo, Gpr161 or Gli2). Ciliary Smo or ciliary tip Gli2 was quantitated in 25 cilia from 3 independent cell lines of each genotype. Ciliary Gpr161 was quantitated in 25 cilia from 1 cell line of each genotype. Groups were compared by ANOVA (*p=<0.05, **p=<0.01 and ***p=<0.001, ns: not significant). Cilia length and percent ciliation for these cells is shown in Fig. 3D. Scale bars are 10 μm and apply to all images in B, C and D. E. Ift27+/+and Ift27null1/null1 MEFs were transfected with SmoM2-mCherry, fixed and stained for cilia (6-11B-1, red) and Gli2 (green). Note the concentration of Gli2 at the ciliary tip (arrow) of control cells as compared to the broader distribution in the mutant cell. Total Gli2 was quantitated from >100 cilia and was not significantly different in the two groups. The distribution of Gli2 along the cilium was quantitated by determining what percentage of the cilium length had Gli2 fluorescence intensity above background. Scale bars are 2 μm and apply to all images. F. Neural tube patterning of Ift27null1/null1 embryos. All images are shown with the ventral side (floor plate) on bottom. Cryosections were cut from caudal regions of E9.5 embryos and immunostained for Olig2 (green) and Shh or Pax6 (red). Merged images with DAPI (blue) are shown in the top row. Arrows depict the absence of Pax6 and Olig2 in the wild type floor plate and an expansion of Pax6 and Olig2 into the mutant floor plate. Scale bar is 50 μm and applies to all images in F. G. Ift27+/+ and Ift27null1/null1 protein extracts from E11.5 hindlimbs were immunoblotted for Gli3 protein (Gli3-FL: full length and Gli3-R: repressor). Quantitation of Gli3 protein levels (ratio of Gli3-FL/Gli3-R) from hindlimbs is shown below the gel (*p=0.032). Number of embryos (n) analyzed is given below genotypes. H. E12.5 Ift27null2, Gli1-LacZ embryos were fixed and stained for β-galactosidase activity. Ift27null2 genotypes are provided above the embryos. Isolated limb buds are shown on the right side. Additional images are in Supplemental Figure 4. Scale bar is 2 mm and applies to whole embryos. FL, forelimb, HL, hindlimb. I. Paraxial mesoderm stained with Smo and Ptch1 antibodies. Sections of E10.5 embryos were stained for cilia (6-11B-1, green) and either Smo or Ptch1 (red). Insets are 4X enlargements of the cilium marked with an arrow. Scale bar is 10 μm. Images are maximum projections of 16 layer Z-stacks acquired every 0.25 μm. Graph at bottom shows ciliary Smo and Ptch1 are significantly (*** p<0.001) increased in the mutant embryos.
Figure 5
Figure 5. BBSome subunits BBS5, BBS9 and BBS regulators Arl6, Lztfl1 accumulate in Ift27 mutant cilia
A. Ift27+/+ and Ift27null1/null1 MEFs were stained for cilia (6-11B-1, red) and BBS5 (top row, green), BBS9 (second row, green), Arl6 (third row, green) or Lztfl1 (bottom row, green). Insets show the green channel (BBS5, BBS9, Arl6, Lztfl1). Quantification showed 0% wild type cells had detectable BBS5 in cilia while 88±12% of mutant cells had detectable BBS5 in cilia and 0% wild type cells had strong BBS9 in cilia (all had weak ciliary staining with moderate staining of the centrosomal region) while 95±6% of mutant cells had strong staining of BBS9 in cilia and no staining of the centrosome (n = 25 cilia from 3 cell lines per genotype, p<0.001). Similarly 0% of wild type cells had detectable Arl6 in cilia while 80±3% of mutant cells had detectable Arl6 in cilia and 0% of wild type cells had detectable Lztfl1 in cilia while 97±2% of Ift27 mutant cells had strong Lztfl11 label in cilia (n = >25 cilia per genotype from three experiments, p<0.001). Scale bar is 10 μm and applies to all images in A. B. Paraxial mesoderm stained with BBS5 and BBS9 antibodies. Sections of E10.5 embryos were stained for cilia (6-11B-1, green) and either BBS5 or BBS9 (red). Insets are 4X enlargements of the cilium marked with an arrow. Scale bar is 10 μm. Images are maximum projections of 16 layer Z-stacks acquired every 0.25 μm.
Figure 6
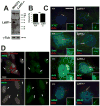
Figure 6. The BBSome regulator Lztfl1 functions downstream of IFT27 in the removal of the BBSome and Smo from cilia
A. NIH3T3 control (+/+) and Lztfl1 mutant (-/-) cells probed for Lztfl1 show that the mutant does not have any detectable protein. γ-tubulin is a loading control. Note the blot is overexposed to ensure that no protein remains. B. Ciliation is not affected by the loss of Lztfl1 (n=3 experiments on 1 cell line). C. NIH3T3 control (+/+) and Lztfl1 mutant cells were stained for cilia (6-11B-1, red) and IFT27 (top row, green), Smo (second row, green), Arl6 (third row, green) or BBS9 (bottom row, green). Insets show the green channel (IFT27, Smo, Arl6, BBS9). Scale bar is 10 μm. Quantification showed 100% of control cilia and Lztfl1 mutant cilia had normal IFT27 label (strong peribasal body label with weaker ciliary shaft label)(n=3 experiments on 1 cell line per genotype); 4.0±4% of control and 60±11% of Lztfl1 mutant cells had ciliary Smo label in unstimulated cells. (n=3 experiments on 1 cell line per genotype, p<0.01); 0% of control cilia and 59±26% of Lztfl1 mutant cilia had weak but detectable levels of Arl6 (n=3 experiments on 1 cell line per genotype, p<0.05); 0% of control cilia and 98±2% of Lztfl1 mutant cilia had strong ciliary BBS9 label (n=3 experiments on 1 cell line per genotype, p<0.001). D. The N-terminal half of Lztfl1 (residues 1-144) does not localize to cilia and does not perturb ciliation or increase the ciliary levels of BBS9. Quantification showed that 0/10 ciliated transfected cells had detectable ciliary BBS9. The C-terminal half of Lztfl1 (residues 145-299) localizes to cilia and causes BBS9 to accumulate in cilia. Quantification showed that 10/10 ciliated transfected cells had detectable ciliary BBS9. Arrows mark cilia on myc-positive cells and arrowheads mark cilia on myc-negative cells. Scale bar is 10 μm.
Figure 7
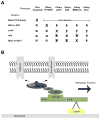
Figure 7. Model for IFT25/IFT27 function
A. Graphical summary of the effects of Ift and Bbs mutations on ciliary assembly and localization of IFT, BBS and hedgehog components. X means the process or localization was blocked by the mutation in the left column; = means the process or localization is not affected by the mutation and the arrow indicates that the protein is elevated in the cilia on the mutant cells. The crossed out arrow means that we cannot detect the protein in cilia on wild type cells and the ciliary level is not increased in the mutant. B. Model for function of IFT25/IFT27. Details are provided in the Discussion.

Comment in

Similar articles

Cited by

References

    1. Aldahmesh MA, Li Y, Alhashem A, Anazi S, Alkuraya H, Hashem M, Awaji AA, Sogaty S, Alkharashi A, Alzahrani S, Al Hazzaa SA, Xiong Y, Kong S, Sun Z, Alkuraya FS. IFT27, encoding a small GTPase component of IFT particles, is mutated in a consanguineous family with Bardet-Biedl syndrome. Hum Mol Genet. 2014;23:3307–3315. - PMC - PubMed
    1. Badano JL, Mitsuma N, Beales PL, Katsanis N. The ciliopathies: an emerging class of human genetic disorders. Annu Rev Genomics Hum Genet. 2006;7:125–148. - PubMed
    1. Bai CB, Auerbach W, Lee JS, Stephen D, Joyner AL. Gli2, but not Gli1, is required for initial Shh signaling and ectopic activation of the Shh pathway. Development. 2002;129:4753–4761. - PubMed
    1. Berbari NF, Lewis JS, Bishop GA, Askwith CC, Mykytyn K. Bardet-Biedl syndrome proteins are required for the localization of G protein-coupled receptors to primary cilia. Proc Natl Acad Sci U S A. 2008;105:4242–4246. - PMC - PubMed
    1. Bhogaraju S, Cajanek L, Fort C, Blisnick T, Weber K, Taschner M, Mizuno N, Lamla S, Bastin P, Nigg EA, Lorentzen E. Molecular basis of tubulin transport within the cilium by IFT74 and IFT81. Science. 2013;341:1009–1012. - PMC - PubMed

Publication types

Substances