. 2015 Mar:90:33-41.
doi: 10.1016/j.neuropharm.2014.10.017. Epub 2014 Nov 1.

Elevated levels of kynurenic acid during gestation produce neurochemical, morphological, and cognitive deficits in adulthood: implications for schizophrenia

Affiliations

Elevated levels of kynurenic acid during gestation produce neurochemical, morphological, and cognitive deficits in adulthood: implications for schizophrenia

Michelle L Pershing et al. Neuropharmacology. 2015 Mar.

Abstract

The levels of kynurenic acid (KYNA), an endogenous negative modulator of alpha7 nicotinic acetylcholine receptors (α7nAChRs), are elevated in the brains of patients with schizophrenia (SZ). We reported that increases of brain KYNA in rats, through dietary exposure to its precursor kynurenine from embryonic day (ED)15 to postnatal day (PD) 21, result in neurochemical and cognitive deficits in adulthood. The present experiments focused on the effects of prenatal exposure to elevated kynurenine on measures of prefrontal excitability known to be impaired in SZ. Pregnant dams were fed a mash containing kynurenine (100 mg/day; progeny = EKYNs) from ED15 until ED22. Controls were fed an unadulterated mash (progeny = ECONs). The dietary loading procedure elevated maternal and fetal plasma kynurenine (2223% and 693% above controls, respectively) and increased fetal KYNA (forebrain; 500% above controls) on ED21. Elevations in forebrain KYNA disappeared after termination of the loading (PD2), but KYNA levels in the prefrontal cortex (PFC) were unexpectedly increased again when measured in adults (PD56-80; 75% above controls). We also observed changes in several markers of prefrontal excitability, including expression of the α7nAChR (22% and 17% reductions at PD2 and PD56-80), expression of mGluR2 (31% and 24% reductions at ED21 and PD56-80), dendritic spine density (11-14% decrease at PD56-80), subsensitive mesolimbic stimulation of glutamate release in PFC, and reversal/extra-dimensional shift deficits in the prefrontally-mediated set-shifting task. These results highlight the deleterious impact of elevated KYNA levels during sensitive periods of early development, which model the pathophysiological and cognitive deficits seen in SZ.

Keywords: Alpha7 nicotinic receptors; Glutamate; Kynurenic acid; Prefrontal cortex; Schizophrenia; Set-shifting.


Figures

Figure 1
Figure 1
Representative Microelectrode Array (MEA) Calibration Curve. The MEA is calibrated in vitro immediately prior to implantation into the mPFC. Calibrations were performed in a stirred solution of phosphate-buffered saline (PBS) (0.05 M, 40 ml; pH 7.4; 37°C; +0.7 V). After a stable baseline was established, ascorbic acid (AA, 250 μM), glutamate (3x 20 μM), dopamine (DA, 2 mM), and H2O2 (8.8 μM), were sequentially added (marked by arrows) to the calibration beaker in 40 μL aliquots, and amperometric signals were acquired at a rate of 1.0 Hz. To simplify the Figure, only two of the four channels are illustrated. The response of glutamate-sensitive (top tracing) and sentinel (bottom tracing) channels in a representative calibration are shown. Current (nAmp) is depicted along the vertical axis and time (s) along the horizontal axis. Successive aliquots of glutamate produced a linear increase in current on the Gluox channel, but no glutamate-related current on the sentinel channel. Important for self-referencing, the calibration also reveals equivalently high sensitivities on both channels to the reporting molecule H2O2. The m-PD barrier prevents the recording of in vivo interferents, AA and DA.
Figure 2
Figure 2
Effects of prenatal exposure to kynurenine on levels of KYNA in the PFC throughout development. KYNA levels (mean ± SEM) are presented for ED21 fetuses on the left Y-axis and for PD2 and PD56-80 offspring on the right Y-axis. Exposure to kynurenine (100 mg/day; EKYN) raised brain KYNA near the end of treatment on ED21 (ECON: n = 8; EKYN: n = 8). There was no difference at PD2 (ECON: n = 8; EKYN: n = 8) yet increased KYNA levels re-appeared as EKYNs reached PD56 (ECON: n = 8; EKYN: n = 8). * P <0.05, *** P < 0.001 vs. ECON.
Figure 3
Figure 3
Relative expression of mGluR2 and α7nAChR mRNA levels normalized to GAPDH mRNA at ED21, PD2, and PD56-80. Levels (mean ± SEM) for EKYNs at each age (n = 7, 8, and 8, respectively) are normalized to ECONs (n = 8, 8, and 8, respectively), and were set to a value of 1. mGluR2 expression was inversely related to KYNA levels, with decreased expression on ED21 and PD56-80. In contrast, α7nAChR mRNA was decreased at PD2 and trended toward a decrease at PD56-80. * P < 0.05, ** P <0.01.
Figure 4
Figure 4
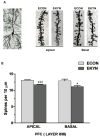
Effects of elevated KYNA on the density of dendritic spines in PFC. ECON (n=7) and EKYN (n=6) progeny were reared to PD56-80, when brains were collected for dendritic spine analysis. A. Golgi-impregnated pyramidal neuron from layer 2/3 of the mPFC (top left), with segments of apical (top middle) and basal (top right) dendrites from representative ECON and EKYN rats. B. Quantification of apical (bottom left) and basal (bottom right) dendritic spine density revealed a significant reduction of layer 2/3 spines of EKYN rats compared to ECON rats. * P < 0.05, *** P < 0.001. Bars represent mean ± SEM; scale bars: 20 μm, cell and 2 μm, segments.
Figure 5
Figure 5
Stimulated prefrontal glutamate release is attenuated in adult EKYN rats. A. Representative MEA tracings taken from the mPFC following the infusion of the middle-dose (0.15 μg) of NMDA in ECON (left panel) and EKYN (right panel) rats. The top tracings represent the signal from the Gluox (glutamate-sensitive) channel, whereas the middle tracings represent the sentinel (background) channel. Subtraction of the two yields the self-referenced signal and represents the signal obtained exclusively from the oxidation of extracellular glutamate (bottom tracings). The Figure represents passage of time (sec) on the x-axis and molar changes from basal extracellular glutamate, calculated using the regression lines from the calibration which converts H2O2-derived current (nAmp) to glutamate concentration (μM) on the y-axis. NMDA infusion (arrows) results in a robust (4.65 μM) increase in prefrontal glutamate release in the ECON rat, which persisted. In contrast, glutamate release is markedly attenuated in the EKYN rat (0.66 μM). B. Group data representing the maximum peak amplitude (mean ± SEM) increase in prefrontal glutamate release (μM), relative to basal values, in adult ECON (n = 7) and EKYN (n = 5) rats following the infusion of three different doses of NMDA (0.05, 0.15, and 0.30 μg in 0.5 μL) into the shell of the nucleus accumbens. There was a marked shift in the dose-response curve following prenatal kynurenine treatment, as EKYN rats were less sensitive to infusion of 0.05 and 0.15 μg of NMDA compared to ECONs (** P <0.01, *** P <0.001). In contrast, glutamate release following 0.30 μg NMDA was similar between ECON and EKYN rats. C. Representative photomicrographs of Nissl-stained tissue sections highlight the minimal tissue disruption and placements of the MEA in the prelimbic/infralimbic PFC, and the termination of the infusion cannula in the shell of the nucleus accumbens.
Figure 6
Figure 6
Mean trials to criterion (± SEM) for adult ECON (n = 7) and EKYN (n = 8) rats (PD56-80) in various stages of the attentional set-shifting task. All rats readily acquired the single (SD) and compound (CD) stages of training. The EKYN group required more trials than the ECON group to acquire REV1. Each group demonstrated comparable abilities to form an attentional set, as evidenced by the rapid acquisition of an intra-dimensional shift (ID) to a novel stimulus. EKYN rats exhibited a marked deficit in the ability to make an extra-dimensional shift (ED). a = significantly different, within treatment group, from the trials to criterion for the CD stage; b = significantly different from ECON within the REV1 stage; c = significantly different, within treatment group, from the trials to criterion for the ID stage; d = significantly different from ECON within the ED stage (all P values < 0.05).

Similar articles

Cited by

References

    1. Akbarian S, Bunney WE, Potkin SG, Wigal SB, Hagman JO, Sandman CA, Jones EG. Altered distribution of nicotinamide-adenine dinucleotide phosphate diaphorase cells in frontal-lobe of schizophrenics implies disturbances of cortical development. Archives of General Psychiatry. 1993;50:169–177. - PubMed
    1. Albuquerque EX, Schwarcz R. Kynurenic acid as an antagonist of alpha 7 nicotinic acetylcholine receptors in the brain: Facts and challenges. Biochemical Pharmacology. 2013;85:1027–1032. - PMC - PubMed
    1. Alexander KS, Bortz DM, Wu HQ, Brooks JM, Schwarcz R, Bruno JP. Perinatal elevations of kynurenic acid dysregulate prefrontal glutamate release and produce set-shifting deficits in adults: A new model of schizophrenia. Society for Neuroscience Meeting Planner 163.23. 2011 http://www.abstractsonline.com/plan/start.aspx?mkey=%7B8334BE29-8911-499....
    1. Alexander KS, Wu HQ, Schwarcz R, Bruno JP. Acute elevations of brain kynurenic acid impair cognitive flexibility: normalization by the alpha7 positive modulator galantamine. Psychopharmacology. 2012;220:627–637. - PMC - PubMed
    1. Alexander KS, Pocivavsek A, Wu HQ, Pershing ML, Schwarcz R, Bruno JP. Early developmental elevations of brain kynurenic acid impair cognitive flexibility in adults: reversal with galantamine. Neuroscience. 2013;238:19–28. - PMC - PubMed

Publication types

MeSH terms