. 2014 Nov 10;26(5):707-21.
doi: 10.1016/j.ccell.2014.09.005. Epub 2014 Oct 23.

Cancer exosomes perform cell-independent microRNA biogenesis and promote tumorigenesis

Affiliations

Cancer exosomes perform cell-independent microRNA biogenesis and promote tumorigenesis

Sonia A Melo et al. Cancer Cell. .

Abstract

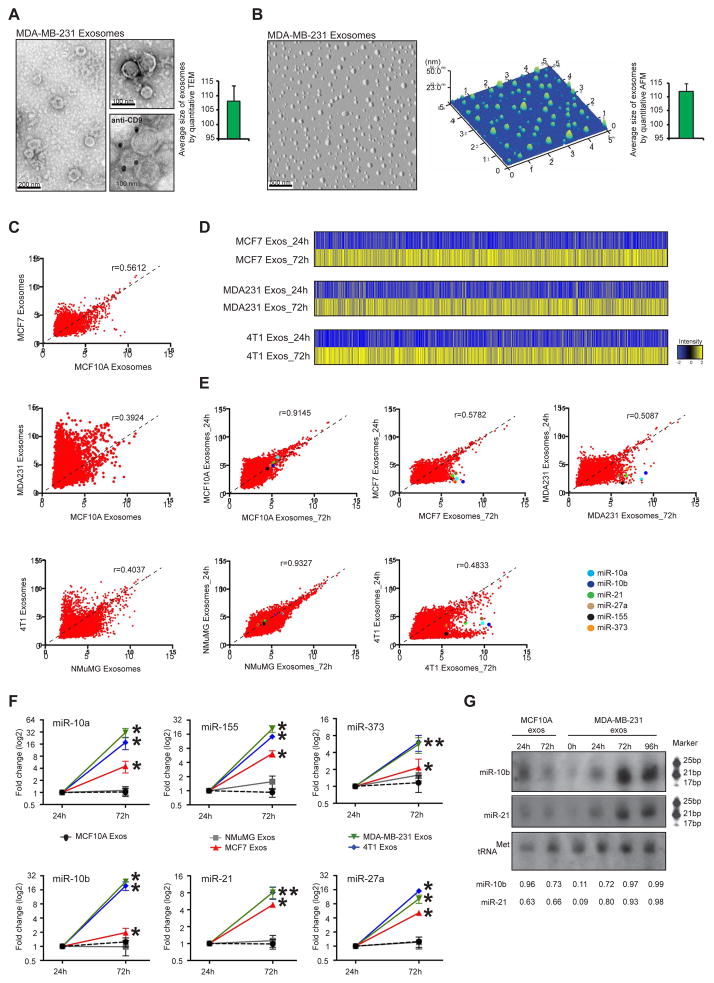
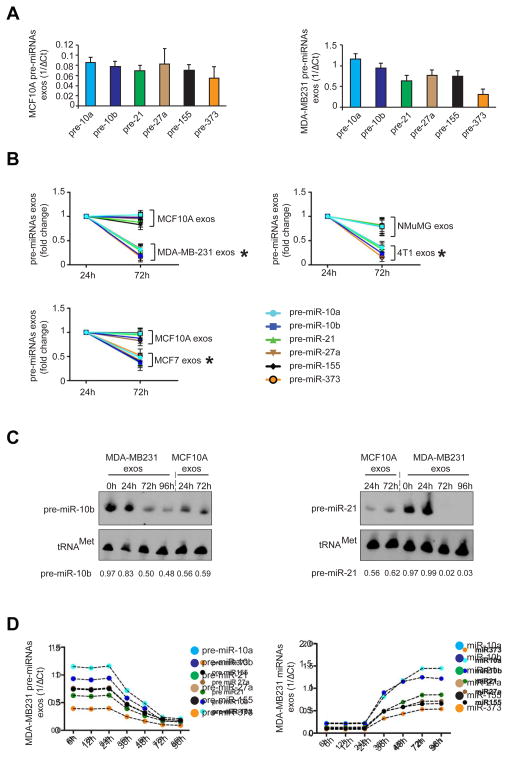
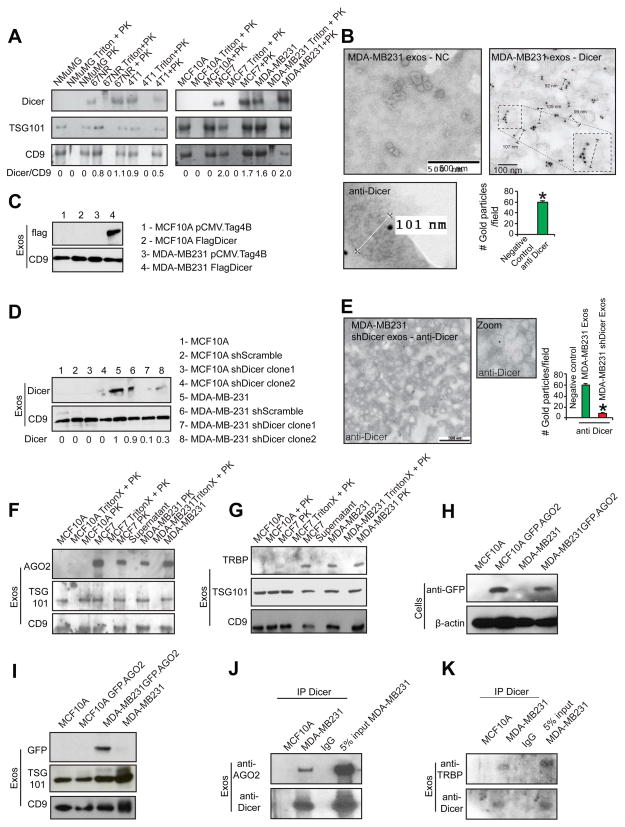
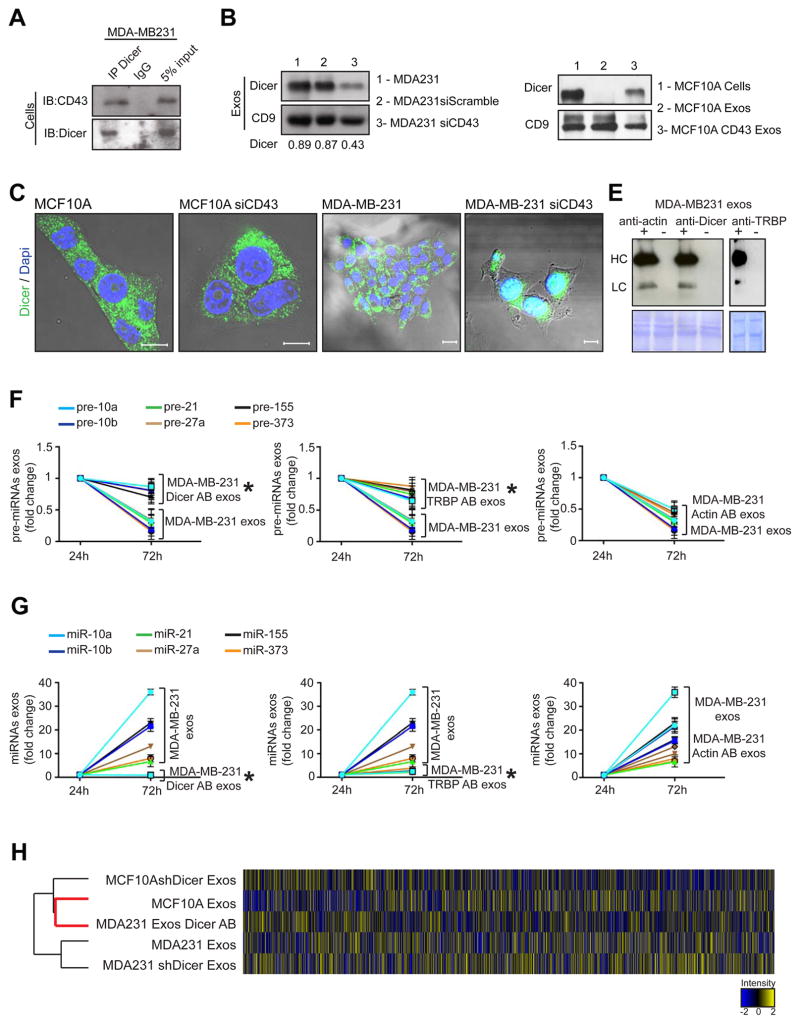
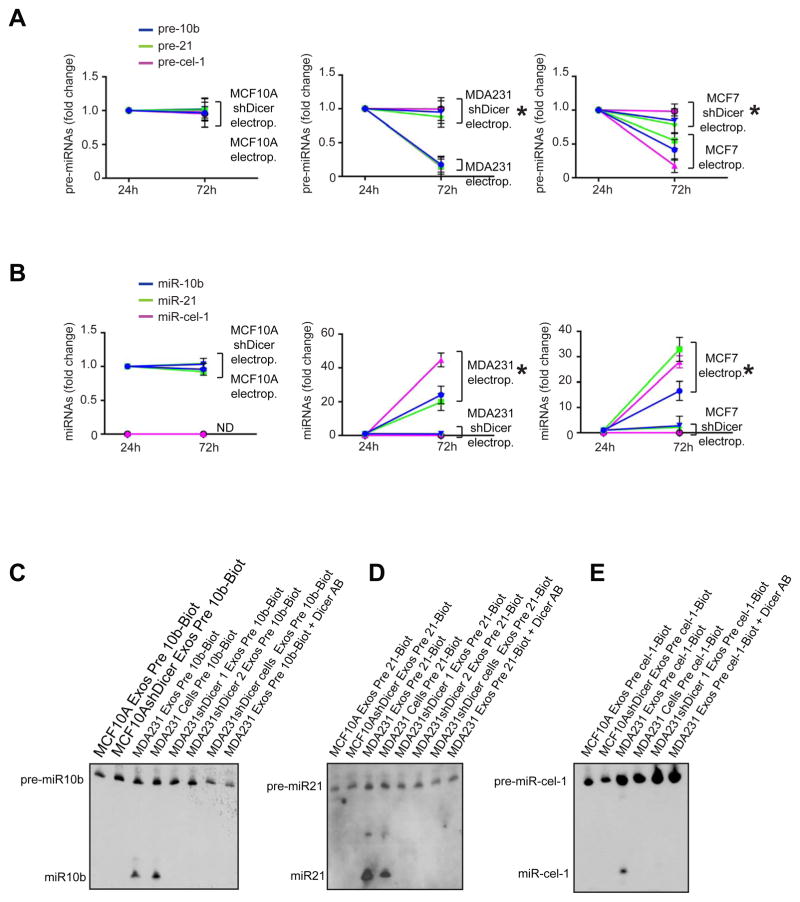
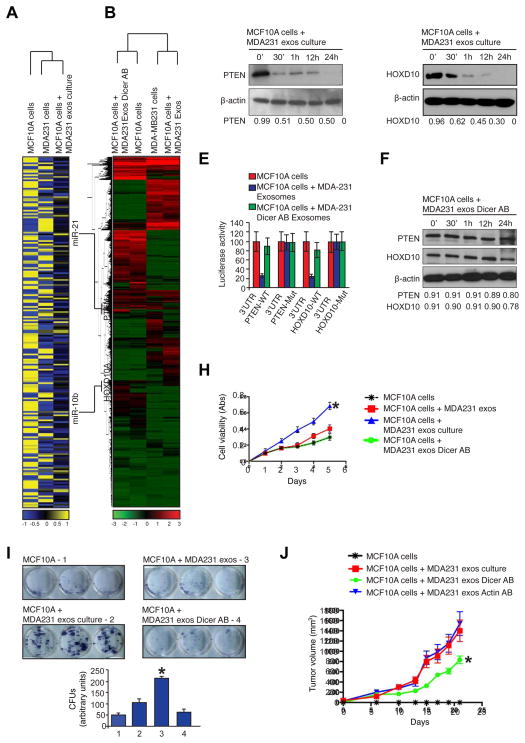
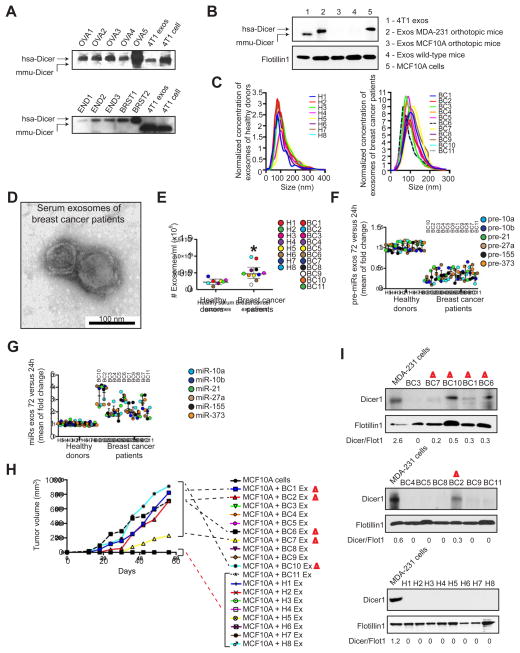
Exosomes are secreted by all cell types and contain proteins and nucleic acids. Here, we report that breast cancer associated exosomes contain microRNAs (miRNAs) associated with the RISC-Loading Complex (RLC) and display cell-independent capacity to process precursor microRNAs (pre-miRNAs) into mature miRNAs. Pre-miRNAs, along with Dicer, AGO2, and TRBP, are present in exosomes of cancer cells. CD43 mediates the accumulation of Dicer specifically in cancer exosomes. Cancer exosomes mediate an efficient and rapid silencing of mRNAs to reprogram the target cell transcriptome. Exosomes derived from cells and sera of patients with breast cancer instigate nontumorigenic epithelial cells to form tumors in a Dicer-dependent manner. These findings offer opportunities for the development of exosomes based biomarkers and therapies.


Figures

Figure 1
Figure 1. Cancer exosomes become enriched in miRNAs
(A) Transmission electron micrograph of MDA-MB-231 exosomes. Lower right image produced by immunogold of CD9 and TEM of MDA-MB-231 exosomes. Gold particles are depicted as black dots. Graph represents the average size of exosomes analyzed from 112 TEM pictures. (B) AFM image of MDA-MB-231 exosomes. Middle graph represents dispersion of particles in the coverslip with size range of exosomes. Right graph represents average size of exosomes analyzed from 26 AFM pictures. (C) Scattterplots of miRNAs expression assessed by miRNA array, in MCF-7, MCF10A, MDA-MB-231, 4T1 and NMuMG exosomes. Pearson correlation coefficient, r, is used as a measure of the strength of the linear relationship between 2 exosomes samples. (D) HeatMaps of miRNAs expression array of cancer exosomes cultured for 24 and 72 hr (MCF-7 exosomes cultured for 24 hr versus MCF-7 exosomes cultured for 72 hr; MDA-MB-231 exosomes cultured for 24 hr versus MDA-MB-231 exosomes cultured for 72 hr; and 4T1 exosomes cultured for 24 hr versus 4T1 exosomes culture for 72 hr) (see Extended Experimental Procedures). (E) Scattterplots of miRNAs expression assessed by miRNA array, in exosomes cultured for 24 versus 72 hr of MCF10A, MCF-7, MDA-MB-231, NMuMG and 4T1 cells. Pearson correlation coefficient, r, is used as a measure of the strength of the linear relationship between the two exosomes samples. miR-10a, miR-10b, miR-21, miR-27b, miR-155 and miR-373 are color-coded and identified in the scatterplots. (F) MCF10A, NMuMG, MCF7, MDA-MB-231 and 4T1 exosomes were resuspended in DMEM media FBS-depleted and maintained in cell-free culture for 24 and 72 hr. After 24 and 72 hr, exosomes were recovered and 6 miRNAs were quantified by qPCR. The fold-change of each miRNA in exosomes after 72 hr cell-free culture was quantified relative to the same miRNA in exosomes after 24 hr cell-free culture. The plots represent the fold-change for the miRNAs in exosomes harvested after 72 hr compared to those harvested after 24 hr. (G) Northern blots of miR-10b and miR-21 from normosomes after 24 and 72 hr of cell-free culture and cancer exosomes without culture and with 24, 72 and 96 hr of cell-free culture. The tRNAMet was used as a loading control. Quantification was done using Image J software. qPCR data represented are the result of 3 independent experiments each with 3 replicates and are represented as ± SEM. Significance was determined using t tests (*p<0.05). See also Figure S1, Tables S1–6.
Figure 2
Figure 2. Cancer exosomes get depleted of pre-miRNAs
(A) Six pre-miRNAs were quantified by qPCR of MCF10A and MDA-MB231 exosomes. The inverse of the ΔCt value for each pre-miRNA was plotted. (B) Cancer exosomes and normosomes were resuspended in DMEM media depleted of FBS and maintained for 24 and 72 hr in cell-free culture conditions. After 24 and 72 hr exosomes were extracted and 6 pre-miRNAs were quantified by qPCR. Graphs show fold-change of each pre-miRNA in MCF10A and MDA-MB231 exosomes after 72 hr of cell-free culture relative to 24 hr cell-free culture. (C) Northern blots of pre-miR-10b and pre-miR-21 using MCF10A normosomes after 24 and 72 hr of cell-free culture, and MDA-MB231 cancer exosomes with 0, 24, 72 and 96 hr of cell-free culture. The tRNAMet was used as a loading control. Quantification was done using Image J software. (D) Pre-miRNAs (left graph) and mature miRNAs (right graph) of cancer exosomes (MDA-MB231) were quantified after 6, 12, 24, 36, 48, 72 and 96 hr of cell-free culture conditions. The inverse of the ΔCt value for each pre-miRNA (left graph) and miRNA (right graph) at different time points was plotted. The data presented are the result of 3 independent experiments each with 3 replicates and are represented as ± SEM; significance was determined using t tests (*p<0.05). Northern blots were performed once to validate qPCR and miRNAs array data. See also Figure S2.
Figure 3
Figure 3. Cancer exosomes contain RLC proteins
(A) Immunoblot of Dicer in exosomes harvested from: NMuMG, MCF10A, MCF7, MDA-MB-231, 67NR and 4T1 cells. Controls used were: exosomes treated with TritonX followed by proteinase K treatment (Triton + PK); and exosomes treated with proteinase K (PK). Immunoblots for TSG101 (second row) and CD9 (third row) are shown. Quantification is the ratio of Dicer and CD9 intensity bands as quantified by Image J software. (B) TEM of immunogold of Dicer in MDA-MB-231 exosomes. Right image contains zoomed inset to show labeling in one exosomes with diameter of 103 nm. Left bottom image is digitally zoomed from a new independent image of the extraction. Negative control (NC) refers to secondary antibody. Gold particles are depicted as black dots. Right lower graph represents the average number of gold dots in 10 different fields of each of the two samples on the top. (C) Immunoblot for flag (upper panel) in MCF10A and MDA-MB231 exosomes harvested from cells transfected with empty vector (pCMV-Tag4B; first and third lanes respectively) and Flag-Dicer vector (second and fourth lanes). CD9 immunoblot was used as a loading control (lower panel). (D) Immunoblot for Dicer in exosomes extracted from MCF10A and MDA-MB231 parental cells and cells transfected with shScramble and shDicer plasmids (upper blot). CD9 immunoblot was used as a loading control (lower blot). Immunoblot quantification was done using Image J software. (E) TEM of immunogold of Dicer in cancer exosomes derived from MDA-MB231shDicer cells. Gold particles are depicted as black dots. Right graph represents the average number of gold dots in 10 different fields of the same sample. (F) Immunoblot of AGO2 in exosomes harvested from MCF7, MDA-MB231 and MCF10A cells. Controls used were: exosomes treated with Triton X followed by proteinase K (Triton X + PK); exosomes treated with proteinase k (PK); and supernatant after ultracentrifugation to harvest exosomes (Supernatant). Immunoblots of TSG101 (second row) and CD9 (third row) are shown. (G) Immunoblot of TRBP in exosomes harvested from MCF7, MDA-MB231 and MCF10A cells. The controls used were: exosomes treated with Triton X followed by proteinase K (Triton X + PK); exosomes treated with proteinase K (PK); and supernatant after ultracentrifugation to harvest exosomes (Supernatant). TSG101 (second row) and CD9 (third row) immunoblots were used as exosomes markers. (H) Immunoblot of GFP in MCF10A and MDA-MB231 cells transfected with GFP-AGO2 plasmid (upper panel). Beta actin was used as loading control (lower panel). (I) Immunoblot of GFP antibody in exosomes extracted from MCF10A and MDA-MB231 cells transfected with GFP-AGO2 plasmid (upper panel). TSG101 (middle panel) and CD9 (lower panel) were used as loading controls. (J) Immunoblot of AGO2 in exosomal proteins extracted from MCF10A and MDA-MB231 cells immunoprecipitated with Dicer antibody or IgG (upper panel). 5% of the lysate input of MDA-MB-231 exosomes was used as control. Immunoblot of Dicer was used as control for immunoprecipitation (lower panel). (K) Immunoblot of TRBP antibody in exosomal proteins extracted from MCF10A and MDA-MB231 cells immunoprecipitated with Dicer antibody or IgG (upper panel). Lysate input of MDA-MB-231 exosomes (5%) was used as control. Immunoblot of Dicer was used as control for immunoprecipitation (lower panel). Data are represented as meanlot of See also Figure S3.
Figure 4
Figure 4. Cancer exosomes process pre-miRNAs to generate mature miRNAs
(A) Immunoblot for CD43 and Dicer in MDA-MB-231 cell lysates immunoprecipitated with Dicer antibody and IgG. (B) Immunoblot of Dicer in MDA-MB-231siCD43 exosomes. CD9 was used as a loading control and quantification achieved by Image J software. (C) Dicer expression in MCF10A and MDA-MB-231 cells (first and third panels) compared to MCF10A and MDA-MB231siCD43 cells (second and fourth panels). Scale bars 20 μm (two left images) and 10 μm (two right images). (D) Immunoblot of Dicer in MCF10A exosomes (2), exosomes derived from MCF10A cells overexpressing CD43 (3) and MCF10A cells (1). CD9 was used as a loading control. (E) Immunoblot using anti-rabbit and anti-mouse secondary antibody to detect heavy chain (HC) and light chain (LC) primary Dicer, Actin or TRBP antibodies electroporated in exosomes of MDA-MB231 cells. Electroporated exosomes without antibody derived from MDA-MB231 cells were used as negative control. Proteinase K treatments were performed after electroporation. (F) MDA-MB-231 exosomes were harvested in quadruplicate. Samples were electroporated with anti-Dicer, anti-actin, or anti-TRBP antibodies. The 3 samples plus control were left in cell-free culture conditions (FBS-depleted) for 24 and 72 hr. After 24 and 72 hr exosomes were extracted and the 6 pre-miRNAs were quantified by qPCR. The fold-change of each pre-miRNA in exosomes after 72 hr cell-free culture was quantified relative to the same pre-miRNA in exosomes after 24 hr cell-free culture in each sample. The graphical plots represent the fold change of the 6 pre-miRNAs. (G) MDA-MB-231 exosomes were harvested in quadruplicate. Samples were electroporated with anti-Dicer, anti-actin, or anti-TRBP antibodies. The 3 samples plus control were left in cell-free culture conditions (FBS-depleted) for 24 and 72 hr. After 24 and 72 hr exosomes were extracted once again and the 6 miRNAs were quantified by qPCR. The fold-change of each miRNA in exosomes after 72 hr cell-free culture was quantified relative to the same miRNA in exosomes after 24 hr cell-free culture in each sample. The graphical plots are a representation of the fold change of the six miRNAs. (H) HeatMap of miRNAs array MDA-MB-231 exos, exosomes electroporated with Dicer Antibody (MDA231 exos Dicer AB), MCF10A exosomes, MDA-MB-231 shDicer Exosomes and MCF10AshDicer Exosomes. An average of duplicates is represented for each sample. The qPCR data are the result of 3 independent experiments each with 3 replicates and are represented as ± SEM; significance was determined using t tests (*p<0.05). See also Figure S4 and Table S7.
Figure 5
Figure 5. Cancer exosomes process pre-miRNAs to generate mature miRNAs
(A) Synthetic pre-miRNAs -10b, -21 and –cel-1 were electroporated into exosomes from MCF10A (MCF10A electrop.), MCF10AshDicer (MCF10AshDicer electrop.), MDA-MB231 (MDA-MB231 electrop.), MDA-MB231shDicer (MDA-MB231shDicer electrop.), MCF-7 (MCF7 electrop.) and MCF-7shDicer (MCF7 shDicer electrop.) cells. Exosomes were recovered after cell-free culture conditions (FBS-depleted) for 72 hr. Pre-miR-10b, -21 and –cel-1 were quantified by qPCR before and after 72 hr of electroporation and culture. The plots represent the fold-change of pre-miR-10b, -21 and –cel-1 72 hr after electroporation relative to 24 hr after electroporation. (B) Synthetic pre-miRNAs -10b, -21 and –cel-1 were electroporated into exosomes harvested from the same cells as in (A). Exosomes were recovered after cell-free culture conditions (FBS-depleted) for 72 hr. MiR-10b, -21 and –cel-1 were quantified by qPCR before and after 72 hr of electroporation and culture. Plots represent the fold-change of miR-10b, -21 and cel-1 72 hr after electroporation relative to 24 hr after electroporation. (C) Northern blot without detection probe, using samples from dicing assay. Synthetic pre-miR-10b internally labeled with biotin was used for the dicing assay. Samples used were MCF10A, MCF10AshDicer, MDA-MB231 exosomes, MDA-MB231shDicer clone1 and clone2 exosomes, MDA-MB231shDicer cells and MDA-MB231 exosomes electroporated with Dicer antibody. (D) Northern blot without detection probe, using samples from dicing assay. Synthetic pre-miR-21 internally labeled with biotin was used for the dicing assay. Samples used were MCF10A, MCF10AshDicer, MDA-MB231 exosomes, MDA-MB231shDicer clone1 and clone2 exosomes, MDA-MB231shDicer cells and MDA-MB231 exosomes electroporated with Dicer antibody. (E) Northern blot without detection probe using samples from dicing assay. Synthetic pre-cel-miR-1 internally labeled with biotin was used for the dicing assay. Samples used were the same ones as in (D). The qPCR data are the result of 3 independent experiments each with 3 replicates and are represented as ± SEM. See also Figure S5.
Figure 6
Figure 6. Cancer exosomes induce transcriptome alterations in recipient cells and tumor formation in a Dicer-dependent manner
(A) HeatMap of miRNA expression array of MDA-MB231 cells, MCF10A cells and MCF10A cells treated with MDA-MB231 exosomes. An intensity key is given below the HeatMap. Each sample is represented as an average of the duplicates. (B) HeatMap of mRNA expression arrays representing gene abundance. The samples used were MCF10A cells treated with MDA-MB231 exosomes electroporated with Dicer antibody, MCF10A cells, MDA-MB231 cells and MCF10A cells exposed to MDA-MB231 exosomes. An intensity key is given below the HeatMap. (C) Immunoblot of PTEN in protein extracts of MCF10A cells treated for 0, 30 min, 1, 12 and 24 hr with MDA-MB231 cancer exosomes after cell-free culture. Beta actin was used as a loading control. (D) Immunoblot of HOXD10 antibody in protein extracts of MCF10A cells treated for 0, 30 min, 1, 12 and 24 h with MDA-MB231 cancer exosomes after cell-free culture conditions. Beta actin was used as a loading control. (E) Graph showing luciferase reporter activity in MCF10A cells transiently transfected with 3′UTR-PTEN-WT, 3′UTR-PTEN-Mut, 3′UTR-HOXD10-WT and 3′UTR-HOXD10-Mut and treated with MDA-MB231 exosomes. (F) Immunoblot of PTEN (upper panel) and HOXD10 (middle panel) in protein extracts from MCF10A cells treated for 0, 30 min, 1, 12 and 24 hr with MDA-MB-231 exosomes electroporated with Dicer antibody after cell-free culture conditions. Beta actin was used as a loading control. (G) MTT assay during 5 days of culture of MCF10A cells, MCF10A cells treated with MDA-MB231 exosomes with no cell-free culture time, MCF10A cells treated with MDA-MB231 exosomes with cell-free culture time and MCF10A cells treated with MDA-MB231 exosomes electroporated with Dicer antibody with cell-free culture time; significance was determined using one-way ANOVA with Tukey post hoc analysis (* p=0.0027). (H) The colony formation assay shows formation of colonies in culture plate and labeled with MTT reagent after 8 days MCF10A cells culture, MCF10A cells treated with MDA-MB231 exosomes with no cell-free culture time, MCF10A cells treated with MDA-MB231 exosomes with cell-free culture time and MCF10A cells treated with MDA-MB231 exosomes electroporated with Dicer antibody with cell-free culture time. Lower graph show quantification of colonies (CFUs – colony forming units). Significance was determined using one-way ANOVA with Tukey post hoc analysis (*p=0.0003) (I) MCF10A cells, MCF10A cells exposed to MDA-MB-231 cancer exosomes, MCF10A cells exposed to MDA-MB231 cancer exosomes electroporated with Dicer antibody and MCF10A cells exposed to MDA-MB231 cancer exosomes electroporated with Actin antibody were orthotopically injected into the mammary pads of athymic nude mice (n=8 per group). Graph depicts tumor volume with respect to time; significance was determined using one-way ANOVA with Tukey post hoc analysis (*p=0.005). Data are represented as mean ± SEM. See also Figure S6.
Figure 7
Figure 7. Serum from breast cancer patients contain Dicer and process pre-miRNAs
(A) Immunoblot of Dicer and protein extracts from serum exosomes harvested from mice xenografted with human tumors. OVA1-5 are human ovary xenografts; END1-3 are human endometrial xenografts; and BRST1 and 2 are human breast xenografts. 4T1 exosomes and cells were used as controls for murine Dicer. hsa-Dicer represents human Dicer molecular weight and mmu-Dicer represents murine Dicer molecular weight. See Figure S7D (B) Immunoblot of Dicer, that recognizes human and mouse Dicer, and protein extracts from serum exosomes harvested from mice orthotopically implanted with MDA-MB-231 cells or MCF10A cells. 4T1 exosomes and MCF10A cells were used as controls for murine and human Dicer, respectively. hsa-Dicer represents human Dicer molecular weight and mmu-Dicer represents murine Dicer molecular weight. (C) NanoSight shows size distribution of exosomes extracted from the serum of 8 healthy donors (left graph) and 11 breast cancer patients (right graph). Concentration of samples was standardized to better show size. (D) TEM of exosomes harvested from the serum of breast cancer patients (100 μl of serum). (E) Concentration of exosomes from the serum of 8 healthy donors and 11 breast cancer patients assessed by NanoSight. Significance was determined using T test (*p=0.012). (F) Exosomes were harvested from fresh serum of 8 healthy donors and 11 breast cancer patients. The extracted samples were left in cell-free culture conditions for 24 and 72 hr. After 24 and 72 hr, exosomes were recovered and 6 pre-miRNAs were quantified by qPCR. The fold-change of each pre-miRNA in exosomes after 72 hr cell-free culture was quantified relative to the same pre-miRNA in exosomes after 24 hr cell-free culture in each sample. The graphical dot plots represent an average fold-change for the pre-miRNAs in 72 hr exosomes relative to 24 hr exosomes. (100 μl of serum) (G) Exosomes were harvested from fresh serum of 8 healthy donors and 11 breast cancer patients. The extracted samples were left in cell-free culture conditions for 24 and 72 hr. After 24 and 72 hr, exosomes were recovered and 6 miRNAs were quantified by qPCR. The fold-change of each miRNA in exosomes after 72 hr cell-free culture was quantified relative to the same miRNA in exosomes after 24 hr cell-free culture in each sample. The graphical dot plots represent an average fold-change for the miRNAs in 72 hr exosomes relative to 24 hr exosomes. Both panels F and G are the result of three independent qPCRs each with three replicates. (100 μl of serum) (H) MCF10A cells, MCF10A cells mixed with exosomes from healthy donors (H1-8) and MCF10A cells mixed with exosomes from breast cancer patients (BC1-11) were orthotopically injected into the mammary pads of athymic nude mice. The number of exosomes used was calculated per body weight. Samples that have not formed a tumor appear overlapped in the x-axis of the graph. Exosomes alone were injected in all cases. This graph depicts tumor volume with respect to time. (n=2 per sample) (I) Immunoblots of Dicer in protein extracts from the serum exosomes harvested the 11 breast cancer patients and 8 healthy donors using Flotillin1 blot as loading control. Quantification was done using Image J software. Samples highlighted in the immunoblot are the ones that showed tumor formation when injected with MCF10A cells in nude mice (panel H). Data are represented as mean ± SEM. See also Figure S7.

Comment in

  • Cancer. Malicious exosomes.
    Anastasiadou E, Slack FJ. Anastasiadou E, et al. Science. 2014 Dec 19;346(6216):1459-60. doi: 10.1126/science.aaa4024. Science. 2014. PMID: 25525233 No abstract available.

References

    1. Al-Nedawi K, Meehan B, Micallef J, Lhotak V, May L, Guha A, Rak J. Intercellular transfer of the oncogenic receptor EGFRvIII by microvesicles derived from tumour cells. Nature cell biology. 2008;10:619–624. - PubMed
    1. Ambros V. The functions of animal microRNAs. Nature. 2004;431:350–355. - PubMed
    1. Bartel DP. MicroRNAs: target recognition and regulatory functions. Cell. 2009;136:215–233. - PMC - PubMed
    1. Chendrimada TP, Gregory RI, Kumaraswamy E, Norman J, Cooch N, Nishikura K, Shiekhattar R. TRBP recruits the Dicer complex to Ago2 for microRNA processing and gene silencing. Nature. 2005;436:740–744. - PMC - PubMed
    1. Cocucci E, Racchetti G, Meldolesi J. Shedding microvesicles: artefacts no more. Trends in cell biology. 2009;19:43–51. - PubMed

Publication types

MeSH terms

Associated data