. 2015 Jan;185(1):69-84.
doi: 10.1016/j.ajpath.2014.09.013. Epub 2014 Nov 6.

Activation of the Wnt/planar cell polarity pathway is required for pericyte recruitment during pulmonary angiogenesis

Affiliations

Activation of the Wnt/planar cell polarity pathway is required for pericyte recruitment during pulmonary angiogenesis

Ke Yuan et al. Am J Pathol. 2015 Jan.

Abstract

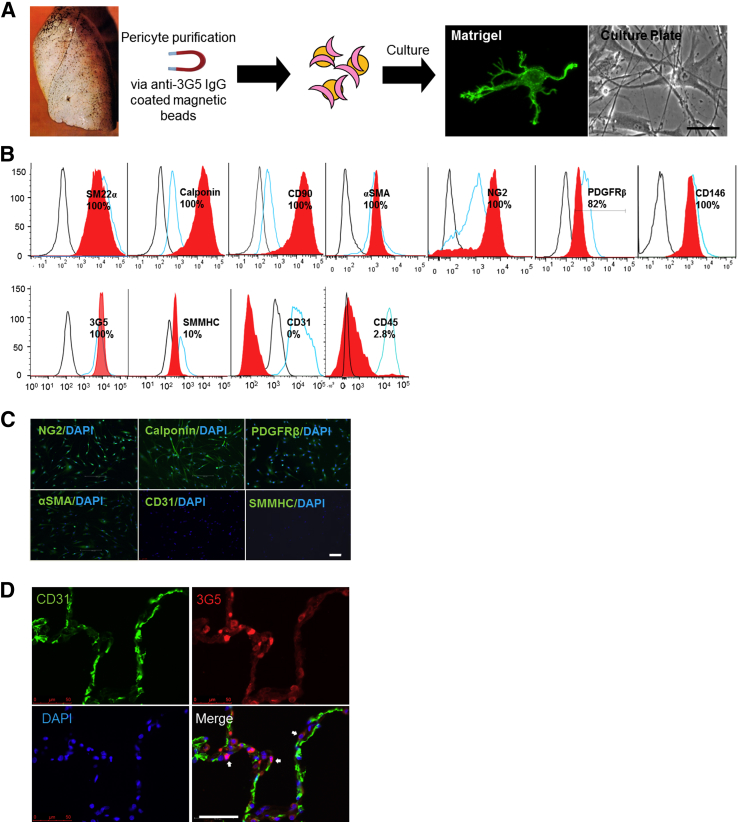
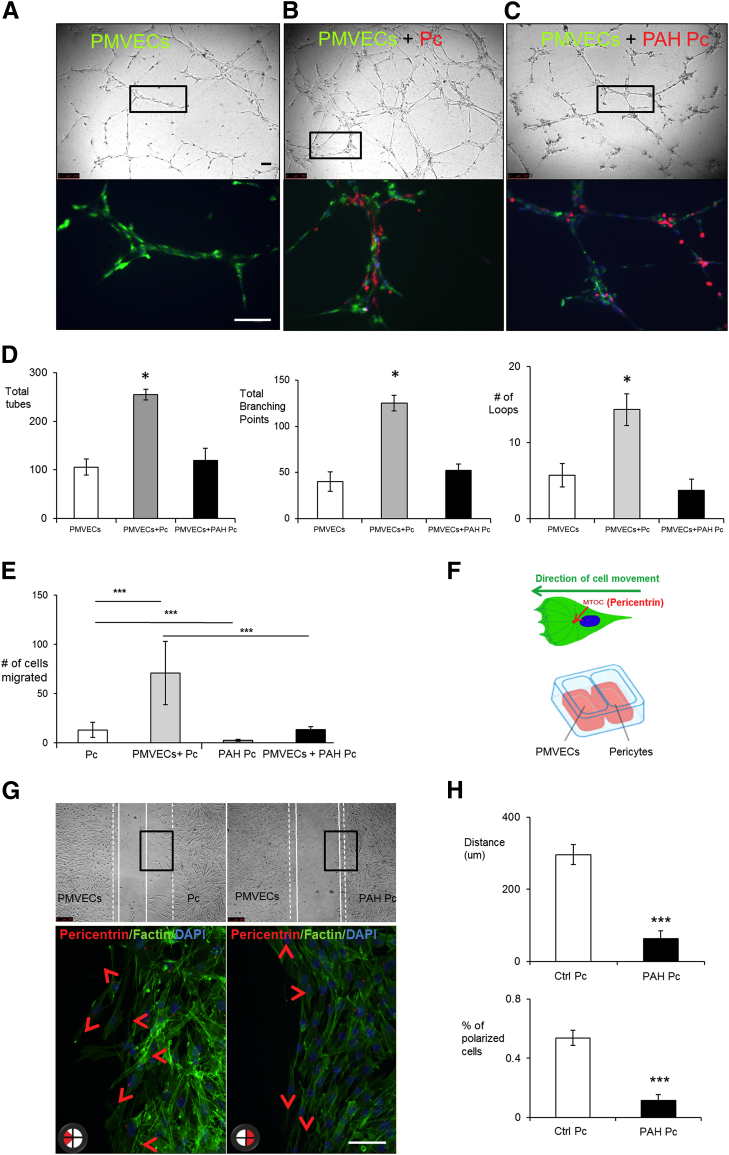
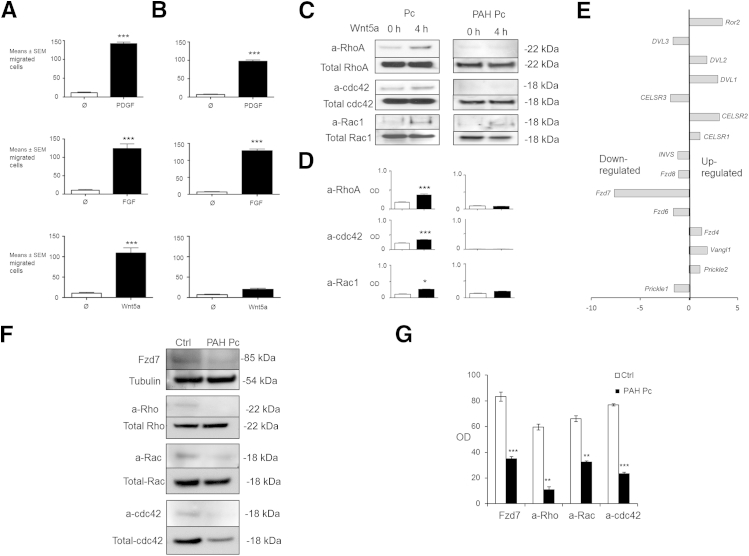
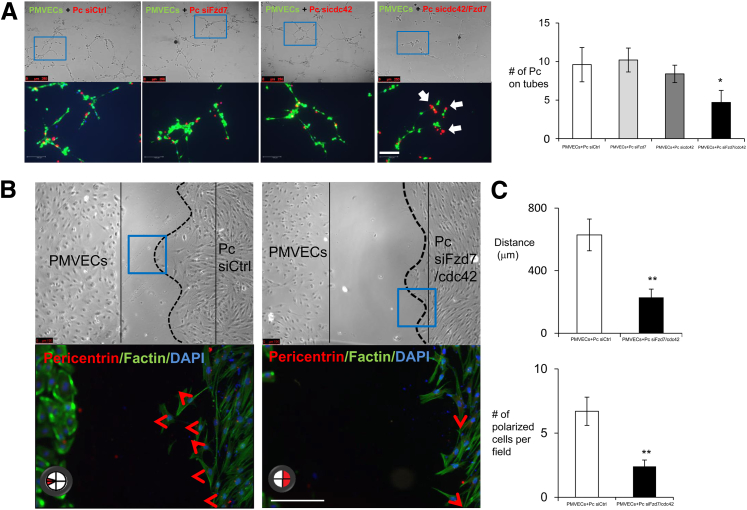
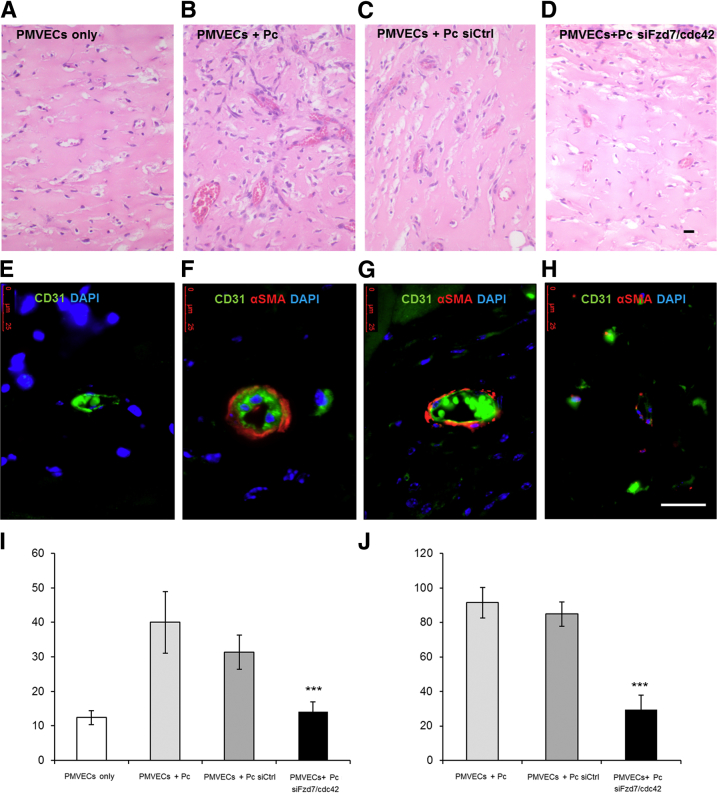
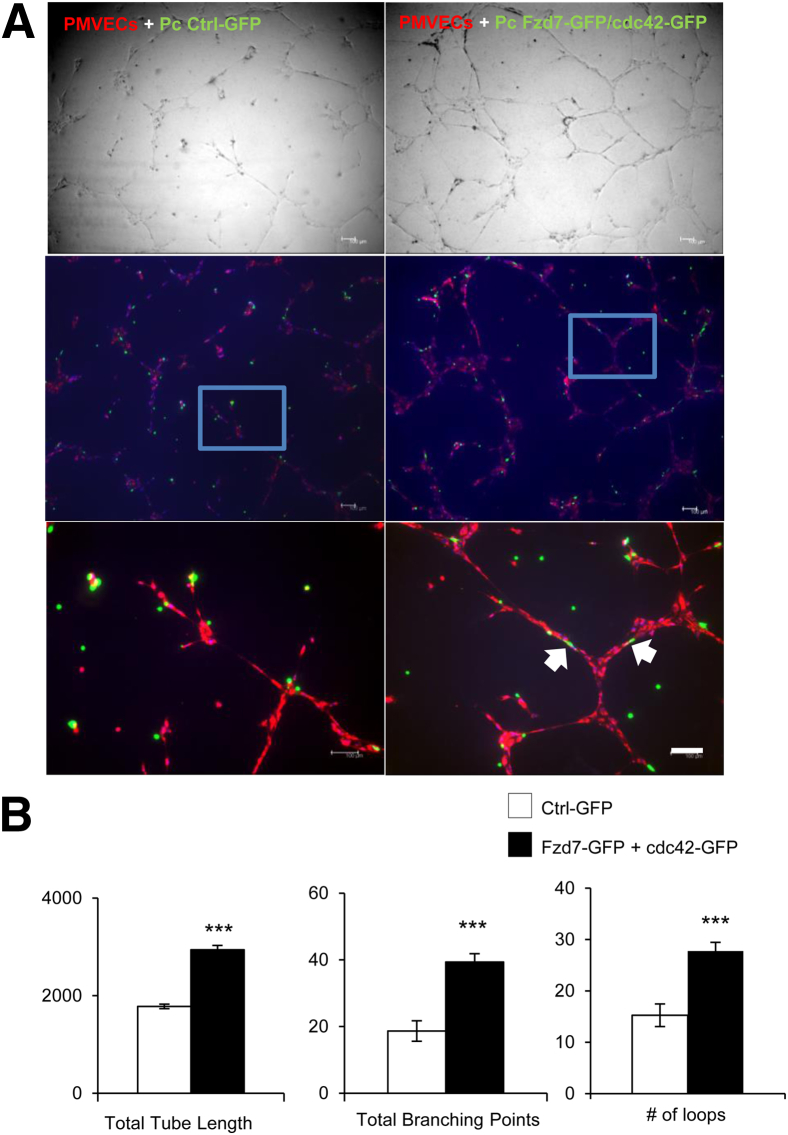
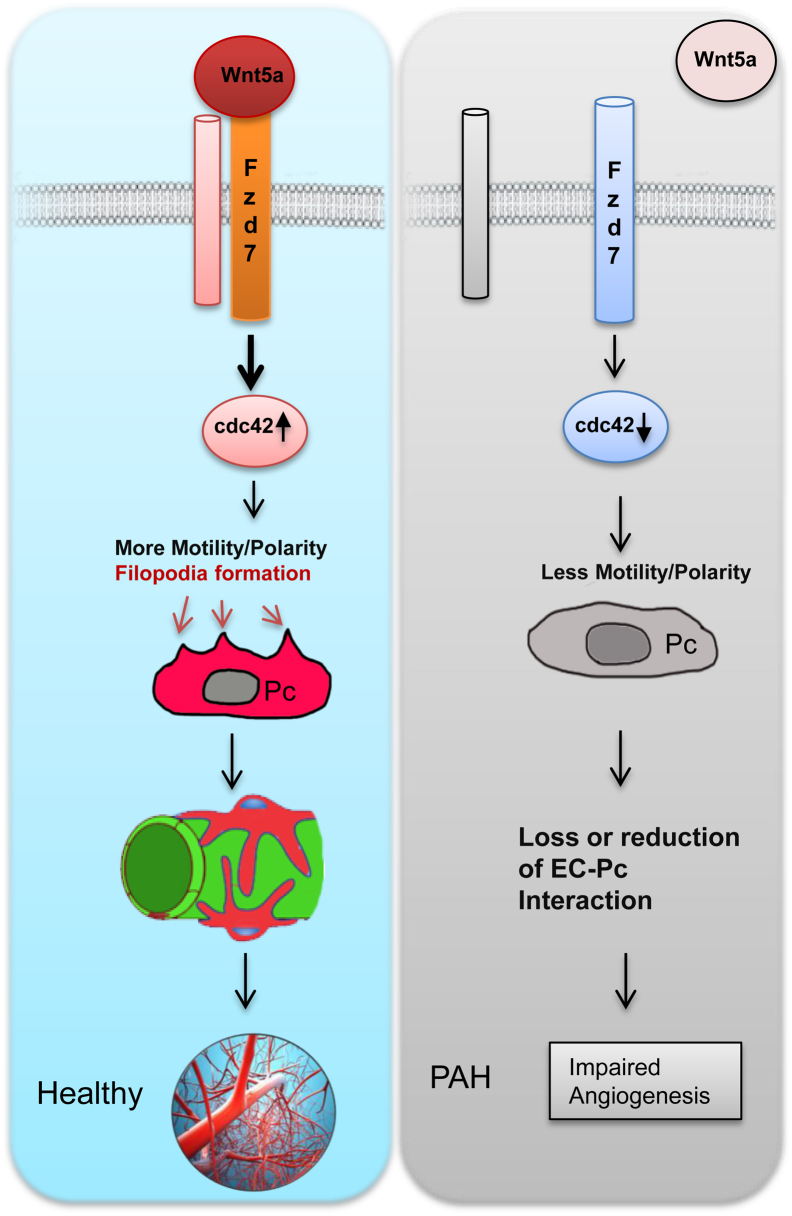
Pericytes are perivascular cells localized to capillaries that promote vessel maturation, and their absence can contribute to vessel loss. Whether impaired endothelial-pericyte interaction contributes to small vessel loss in pulmonary arterial hypertension (PAH) is unclear. Using 3G5-specific, immunoglobulin G-coated magnetic beads, we isolated pericytes from the lungs of healthy subjects and PAH patients, followed by lineage validation. PAH pericytes seeded with healthy pulmonary microvascular endothelial cells failed to associate with endothelial tubes, resulting in smaller vascular networks compared to those with healthy pericytes. After the demonstration of abnormal polarization toward endothelium via live-imaging and wound-healing studies, we screened PAH pericytes for abnormalities in the Wnt/planar cell polarity (PCP) pathway, which has been shown to regulate cell motility and polarity in the pulmonary vasculature. PAH pericytes had reduced expression of frizzled 7 (Fzd7) and cdc42, genes crucial for Wnt/PCP activation. With simultaneous knockdown of Fzd7 and cdc42 in healthy pericytes in vitro and in a murine model of angiogenesis, motility and polarization toward pulmonary microvascular endothelial cells were reduced, whereas with restoration of both genes in PAH pericytes, endothelial-pericyte association was improved, with larger vascular networks. These studies suggest that the motility and polarity of pericytes during pulmonary angiogenesis are regulated by Wnt/PCP activation, which can be targeted to prevent vessel loss in PAH.


Figures

Figure 1
Figure 1
Purification and characterization of lung pericytes using 3G5 IgG–coated magnetic beads. A: Method for pericyte purification. Representative micrographs of lung pericytes stained with calcein AM are shown on Matrigel or on gelatin-coated cell-culture plates. B: Fluorescence-activated cell sorting analysis of lung pericytes using pericyte lineage markers. Red curves represent lung pericytes; blue, positive controls (brain pericytes for pericyte markers CD90, NG2, platelet derived growth factor receptor beta (PDGFRβ), CD146, and 3G5, calponin, and anti-smooth muscle actin (α-SMA); pulmonary artery smooth muscle cells for smooth muscle myosin heavy chain (SMHHC), pulmonary microvascular endothelial cells (PMVEC) for CD31, and peripheral blood mononuclear cells for CD45). C: Immunofluorescence studies of lung pericytes stained with NG2, calponin, PDGFRβ, and α-SMA. Note that no stain is seen with CD31 and SMMHC. D: Confocal images of 3G5-stained lung sections. Endothelium is stained with CD31 (green); pericytes, with 3G5 IgG (red). Arrows indicate pericyte-positive staining. DAPI labels cell nuclei (blue). Scale bars: 20 μm (A); 10 μm (C); 50 μm (D).
Figure 2
Figure 2
Pulmonary arterial hypertension (PAH) pericytes (Pc) fail to associate with pulmonary microvascular endothelial cells (PMVECs) during vascular tube formation and demonstrate reduced polarization to the endothelial monolayer in both Boyden chamber and wound-healing co-culture assays. Matrigel assays show tube formation by PMVEC (PKH67, green) alone (A) and in the presence of pericytes (Pc) (PKH26, red) from healthy donors (B) or from PAH patients (C). Bottom row shows enlargements of the boxes in the top row. Note that pericyte distribution is seen along the length of vascular tubes with healthy pericytes, whereas it appears clustered around nodes with PAH pericytes. D: Numbers of tubes (left), branching points (middle), and loops (right) with PMVECs without and with pericytes from healthy subjects (control) or from PAH patients. E: Boyden chamber comparing translocation of control Pc and PAH pericytes (PAH Pc) in the presence or absence of PMVECs. After 6 hours, pericytes at the bottom of the inserts were fixed and stained with hematoxylin and eosin. The mean number of pericytes from four random 20× fields was used for comparison. F: Estimation of polarization using pericentrin, a marker of the microtubule organization center, and of the wound-healing co-culture assay. G: Representative images of wound-healing co-culture assays in which PMVECs are on the left and pericytes on the right. Bottom row shows enlargements of the boxes in the top row. Cell polarity was assessed by pericentrin (red section in circle at the bottom left of each panel indicates direction). The dashed lines indicate 0 hours; white lines, 6 hours. The arrowheads indicate directions of cell movement. H: Quantification of cell distance and percentage of polarized cells after 6 hours. Data are expressed as means ± SEM of three experiments. P < 0.05 versus PMVEC alone (one-way analysis of variance with Dunnett post-test); ∗∗∗P < 0.001 [one-way analysis of variance with Bonferroni post-test (E)] or versus control [Ctrl; unpaired t-test (H)]. Scale bars = 100 μm.
Figure 3
Figure 3
Reduced Wnt/planar cell polarity activation is present in PAH pericytes. Boyden chamber assays of pericytes from healthy donors (A) and PAH patients (B), stimulated (black bars) with 20 ng/mL PDGF (top row), 10 ng/mL FGF (middle row), and 200 ng/mL Wnt5a (bottom row) over 6 hours. White bars represent nonstimulated cells (control). C: Pull-down assays measuring active (a) forms of RhoA, cdc42, and Rac1 in lysates of Wnt5a-stimulated pericytes from healthy donors (Pc) and PAH patients (PAH Pc) over a period of 4 hours. D: Densitometry values are shown as the ratios of the optical density of the active form relative to the respective total GTPase in whole cell lysates that were run in C gels. The white bars represent no Wnt5a stimulation; black bars, 4-hour Wnt5a stimulation. E: TaqMan quantitative PCR for Wnt/PCP-related components in PAH pericytes. The expression of each gene is shown relative to that in healthy pericytes. F: Representative Western immunoblot images of Fzd7 and cdc42 in whole lysates of pericytes from healthy donors (Ctrl) versus PAH patients (PAH Pc). G: Densitometry values are shown as the ratio of the optical density of the active form relative to the respective total GTPase in whole cell lysates. Blots were probed for total GTPase as a loading control. Data are expressed as means ± SEM of three experiments. P < 0.05, ∗∗P < 0.01, and ∗∗∗P < 0.001 versus control [unpaired t-test (D), one-way analysis of variance with Bonferroni post-test (G)].
Figure 4
Figure 4
Knockdown of both Fzd7 and CDC42 in healthy pericytes shows impaired tube formation and cell polarity. A: Pericytes (Pc) were transfected with nontargeting siRNA control (siCtrl), siFzd7, sicdc42, and siFzd7/cdc42 for 48 hours. Before seeded on Matrigel, cells were stained with PKHs. PMVEC were stained in PKH67, green; Pc in PKH26, red; and DAPI in blue. The blue boxes indicate the enlarged areas of magnification in the bottom row. The white arrows indicate the interaction of EC-Pc. Tube formations and the numbers of pericytes attached to the tubes were assessed after 6 hours. B: Polarity was also assessed and measured on single or double knockout in healthy pericytes. The red arrowheads indicate directions of cell movement. C: Cell movement distances and percentages of polarized cells were quantified when siFzd7/cdc42 were transfected on control pericytes. Data are expressed as means ± SEM of three experiments. P < 0.05, ∗∗P < 0.01 versus control (unpaired t-test). Scale bars = 100 μm.
Figure 5
Figure 5
Reduction of Fzd7 and cdc42 prevents pericyte-induced microvessel formation in SCID mice. Representative images of hematoxylin and eosin staining (A–D) and immunofluorescence (E–H) show the appearance of PMVECs alone (A), PMVECs plus healthy pericytes (Pc) (B) as positive controls, PMVECs plus healthy pericytes transfected with siRNA control (siCtrl) (C), and PMVECs plus healthy pericytes transfected simultaneously with siFzd7 and sicdc42 (D) 14 days after implantation into SCID mice. E–H: Human and murine CD31 is labeled with green fluorescent antibodies, pericytes are labeled with α-SMA-Cy3 red fluorescent antibodies, and nuclei are stained blue with DAPI. Quantification of vessel diameter (I) in micrometers and the percentage of pericyte coverage (J). Data are expressed as means ± SEM of three experiments. ∗∗∗P < 0.001 versus PMVECs + Pc siCtrl. Scale bar = 25 μm.
Figure 6
Figure 6
Transfection of Fzd7 and cdc42 expression constructs in PAH pericytes improve their ability to associate with vascular tubes. A: PAH pericytes were transfected with GFP-tagged Fzd7 and cdc42 plasmids (green) and seeded with PMVECs (red) in Matrigel-coated plates (top row). Bottom row shows enlargements of the boxes in the middle row. The white arrows indicate the interaction of EC-Pc. B: Quantification of total tube lengths in micrometers (left), total number of branching points (middle), and numbers of loops (right). Data are expressed as means ± SEM of three experiments. ∗∗∗P < 0.001 versus control (Ctrl-GFP). Scale bar = 100 μm.
Figure 7
Figure 7
Model representing that Wnt/planar cell polarity signaling contributes to the association between pericytes and developing blood vessels via the Wnt5a-Fzd7-cdc42 axis. The up-regulation of cdc42 on Wnt5a/Fzd7 signaling results in increased motility and polarity, which in turn results in healthy growth. A lack of Wnt5a/Fzd7 signaling results in less motility and polarity, which in turn leads to a loss or reduction of the interaction between endothelial cells (EC) and pericytes (Pc) and eventually a loss of arteries, leading to PAH.

References

    1. Ribatti D., Nico B., Crivellato E. The role of pericytes in angiogenesis. Int J Dev Biol. 2011;55:261–268. - PubMed
    1. Yamagishi S., Imaizumi T. Pericyte biology and diseases. Int J Tissue React. 2005;27:125–135. - PubMed
    1. Diaz-Flores L., Gutierrez R., Madrid J.F., Varela H., Valladares F., Acosta E., Martin-Vasallo P., Diaz-Flores L., Jr. Pericytes. Morphofunction, interactions and pathology in a quiescent and activated mesenchymal cell niche. Histol Histopathol. 2009;24:909–969. - PubMed
    1. Armulik A., Abramsson A., Betsholtz C. Endothelial/pericyte interactions. Circ Res. 2005;97:512–523. - PubMed
    1. Xian X., Hakansson J., Stahlberg A., Lindblom P., Betsholtz C., Gerhardt H., Semb H. Pericytes limit tumor cell metastasis. J Clin Invest. 2006;116:642–651. - PMC - PubMed

Publication types

MeSH terms