. 2015 Jan 1;330(1):199-211.
doi: 10.1016/j.yexcr.2014.10.003. Epub 2014 Oct 16.

The MAPK ERK5, but not ERK1/2, inhibits the progression of monocytic phenotype to the functioning macrophage

Affiliations

The MAPK ERK5, but not ERK1/2, inhibits the progression of monocytic phenotype to the functioning macrophage

Xuening Wang et al. Exp Cell Res. .

Abstract

Intracellular signaling pathways present targets for pharmacological agents with potential for treatment of neoplastic diseases, with some disease remissions already recorded. However, cellular compensatory mechanisms usually negate the initial success. For instance, attempts to interrupt aberrant signaling downstream of the frequently mutated ras by inhibiting ERK1/2 has shown only limited usefulness for cancer therapy. Here, we examined how ERK5, that overlaps the functions of ERK1/2 in cell proliferation and survival, functions in a manner distinct from ERK1/2 in human AML cells induced to differentiate by 1,25D-dihydroxyvitamin D3 (1,25D). Using inhibitors of ERK1/2 and of MEK5/ERK5 at concentrations specific for each kinase in HL60 and U937 cells, we observed that selective inhibition of the kinase activity of ERK5, but not of ERK1/2, in the presence of 1,25D resulted in macrophage-like cell morphology and enhancement of phagocytic activity. Importantly, this was associated with increased expression of the macrophage colony stimulating factor receptor (M-CSFR), but was not seen when M-CSFR expression was knocked down. Interestingly, inhibition of ERK1/2 led to activation of ERK5 in these cells. Our results support the hypothesis that ERK5 negatively regulates the expression of M-CSFR, and thus has a restraining function on macrophage differentiation. The addition of pharmacological inhibitors of ERK5 may influence trials of differentiation therapy of AML.

Keywords: AML; ERK1/2; ERK5; M-CSFR; MAPK; Vitamin D.


Conflict of interest statement

The authors have no conflict of interest to disclose.

Figures

Fig. 1
Fig. 1. Western blots showing the specificity of ERK1/2 and ERK5 inhibitors
(A) HL60 cells were pretreated with either MEK1/2 inhibitors, PD98059 (20 µM) and U0126 (1 µM), or MEK5/ERK5 inhibitors, BIX02189 (10 µM) and XMD8-92 (5 µM), for 1 h, then 1,25D (1 nM) was added for an additional 96 h. TPA (10 nM) treated group was used as positive control. P-ERK1/2 and P-ERK5 protein levels were determined by Western blots. Normalized optical densities of each band are shown in the bar charts. The blots shown are representative of three experiments. CTL = Control. (B) U937 cells were treated in the same manner as HL60 cells. = p<0.05, significantly increased vs. control group; = p<0.05, ◇◇ = p<0.01, significantly decreased vs. control group; # = p<0.05, significantly increased vs. 1,25D-treated group; * = p<0.05, ** = p<0.01, significantly decreased vs. 1,25D-treated group; n=3.
Fig. 2
Fig. 2. Inhibition of the MEK1/2-ERK1/2 and MEK5/ERK5 pathways differentially affects the cell surface marker expression and morphology of AML cells
(A) An example of primary flow cytometry data. These frames show the similarity of changes in cell surface expression of differentiation markers induced by treatment with TPA or MEK5/ERK5 inhibitors together with 1,25D. Note that TPA, like the inhibitors and 1,25D combinations, increases the expression of CD11b (horizontal scale), but reduces the expression of CD14 (vertical scale). HL60 and U937 cells were pretreated with either MEK5/ERK5 inhibitors, BIX02189 (10 µM) and XMD8-92 (5 µM), or TPA 10 (nM) for 1 h, then 1,25D (1 nM) was added for an additional 96 h. N=3. (B) HL60 cells were pretreated with either MEK5/ERK5 inhibitors, BIX02189 (10 µM) and XMD8-92 (5 µM), or MEK1/2 inhibitors, PD98059 (20 µM) and U0126 (1 µM) for 1 h, then 1,25D (1 nM) was added for an additional 96 h. (C) U937 cells were subjected to identical treatments. Following incubations, cell smears were stained with Wright-Giemsa and photographed at 1000× magnification. TPA (10 nM) was used as the positive control for the induction of macrophage differentiation. Arrows indicate the more abundant cytoplasm in cells treated with MEK5/ERK5 inhibitors, alone and in combination with 1,25D, and TPA, typical of macrophages. Other typical features evident in this group are nuclear morphology, ameboid pseudopodia, and abundant cytoplasmic inclusions, better seen in HL60 cells. Scale lines within the panels indicate 10 µm.
Fig. 3
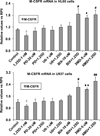
Fig. 3. ERK5 inhibition selectively increases the expression of M-CSFR, a molecular marker of macrophage differentiation, at mRNA level
HL60 or U937 cells were pretreated with either MEK1/2 inhibitors, PD98059 (20 µM) and U0126 (1 µM) or MEK5/ERK5 inhibitors, BIX02189 (10 µM) and XMD8-92 (5 µM), for 1 h, then 1,25D (1 nM) was added for an additional 96 h. The levels of M-CSFR mRNA were determined by SYBRGreen RT-qPCR in both HL60 and U937 cells. = p<0.05, ◆◆ = p<0.01, significantly increased vs. control group; = p<0.05, significantly decreased vs. control group; # = p<0.05, ## = p<0.01, significantly increased vs. 1,25D-treated group.
Fig. 4
Fig. 4. Expression of M-CSFR, a molecular marker of macrophage differentiation, at protein level
AML cells were pretreated with either MEK1/2 inhibitors, PD98059 (20 µM) and U0126 (1 µM) or MEK5/ERK5 inhibitors, BIX02189 (10 µM) and XMD8-92 (5 µM), for 1 h, then 1,25D (1 nM) was added for an additional 96 h. TPA (10 nM) treated cells were used as the positive control. (A) M-CSFR (also known as CD115) total protein levels as determined by Western blotting. Normalized optical densities of each band are shown in the bar charts. Crk-L was used as a loading control. The blots shown are representative of three experiments. CTL = Control. PD = PD98059, U0 = U0126, BIX = BIX02189, XMD = XMD8-92. (B) Expression of surface M-CSFR (CD115) was determined by flow cytometry. = p<0.05, ◆◆ = p<0.01, significantly increased vs. control group; # = p<0.05, ## = p<0.01, significantly increased vs. 1,25D-treated group, n=3.
Fig. 5
Fig. 5. High levels of M-CSFR are required for ERK5 inhibition of macrophage differentiation
AML cells were transfected with silencing oligonucleotides to M-CSFR before addition of 1,25D and ERK5 inhibitor XMD8-92. (A) siM-CSFR abrogated the XMD+1,25D-induced increase in M-CSFR protein levels in HL60 and U937 cells. The protein levels of a loading control, Crk-L, were not significantly altered. (B) The knock down of M-CSFR markedly diminished the effect of XMD8-92 on increasing CD11b expression and inhibition of CD14 expression in both HL60 and U937 cells. Asterisks (*) show a significant (p<0.05) decrease in cells subjected to M-CSFR knockdown, while # denotes a significant (p<0.05) increase.
Fig. 6
Fig. 6. Macrophage-like phenotype induced by inhibition of ERK5 activity in human AML cells ex vivo
(A) Flow cytometric determination of surface expression of M-CSFR of AML cells in primary culture. Mononuclear cells were separated from the total cells in specimens of bone marrow, and then subjected to the same treatment as AML cell lines. The expression of M-CSFR (CD115) in primary cultures was determined by flow cytometry. (B) Normal bone marrow cells in primary culture were treated as described for AML cells. # = p<0.05, significantly increased vs. 1,25D-treated group, n=3. (C) Effect of MEK5/ERK5 inhibitors on cell morphology of human AML cells ex vivo. The cells were stained and photographed similarly to those shown in Fig. 2A and B. The cells shown here were from the FAB subtype M2 sample.
Fig. 7
Fig. 7. MEK5/ERK5 inhibitors, but not MEK1/2-ERK1/2 inhibitors, promote phagocytic activity of AML cells
(A) HL60 cells were pretreated with either MEK5/ERK5 inhibitors, BIX02189 (10 µM) and XMD8-92 (5 µM), or MEK1/2 inhibitors, PD98059 (20 µM) and U0126 (1 µM) for 1 h, then 1,25D (1 nM) was added for an additional 96 h. Cells (5 × 10⁵) were then incubated with opsonized zymosan, smeared on glass slides and stained with Wright-Giemsa. Phagocytosis was determined microscopically at 500× magnification. Arrows indicate examples of cells containing phagocytized zymosan particles. TPA (10 nM) was used here as the positive control for the induction of phagocytosis. (B) U937 cells treated as described above.

Similar articles

Cited by

References

    1. Ridge SA, Worwood M, Oscier D, Jacobs A, Padua RA. FMS mutations in myelodysplastic, leukemic, and normal subjects. Proc Natl Acad Sci U S A. 1990;87:1377–1380. - PMC - PubMed
    1. Rademakers R, Baker M, Nicholson AM, Rutherford NJ, Finch N, Soto-Ortolaza A, Lash J, Wider C, Wojtas A, DeJesus-Hernandez M, Adamson J, Kouri N, Sundal C, Shuster EA, Aasly J, MacKenzie J, Roeber S, Kretzschmar HA, Boeve BF, Knopman DS, Petersen RC, Cairns NJ, Ghetti B, Spina S, Garbern J, Tselis AC, Uitti R, Das P, Van Gerpen JA, Meschia JF, Levy S, Broderick DF, Graff-Radford N, Ross OA, Miller BB, Swerdlow RH, Dickson DW, Wszolek ZK. Mutations in the colony stimulating factor 1 receptor (CSF1R) gene cause hereditary diffuse leukoencephalopathy with spheroids. Nature genetics. 2012;44:200–205. - PMC - PubMed
    1. Barreda DR, Hanington PC, Belosevic M. Regulation of myeloid development and function by colony stimulating factors. Developmental and comparative immunology. 2004;28:509–554. - PubMed
    1. Hamilton JA, Achuthan A. Colony stimulating factors and myeloid cell biology in health and disease. Trends in immunology. 2013;34:81–89. - PubMed
    1. Broughton SE, Hercus TR, Lopez AF, Parker MW. Cytokine receptor activation at the cell surface. Current opinion in structural biology. 2012;22:350–359. - PubMed

Publication types

MeSH terms

Substances