. 2015 Jan-Mar:116-117:88-98.
doi: 10.1016/j.prostaglandins.2014.10.006. Epub 2014 Nov 4.

Ethanol at low concentrations protects glomerular podocytes through alcohol dehydrogenase and 20-HETE

Affiliations

Ethanol at low concentrations protects glomerular podocytes through alcohol dehydrogenase and 20-HETE

Ellen T McCarthy et al. Prostaglandins Other Lipid Mediat. 2015 Jan-Mar.

Abstract

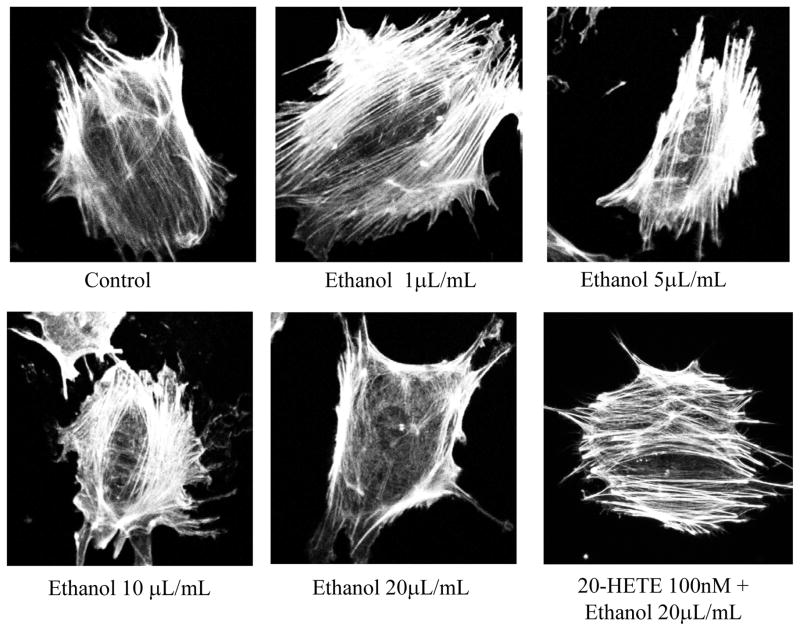
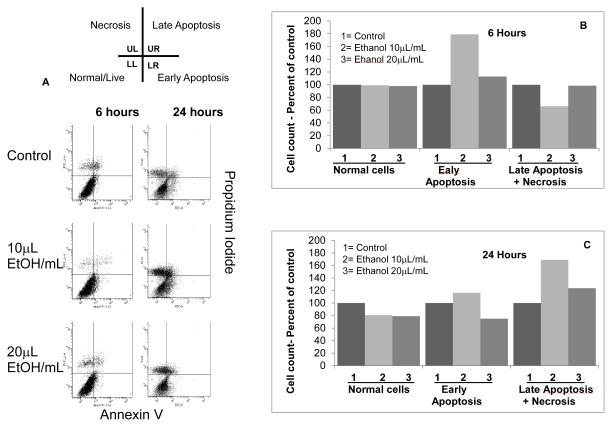
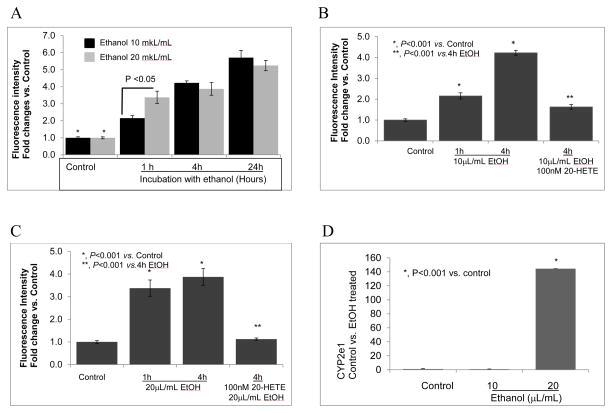
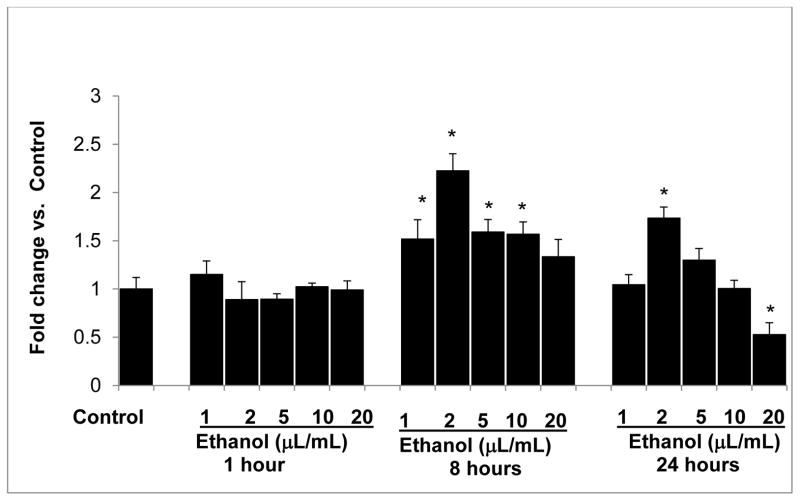
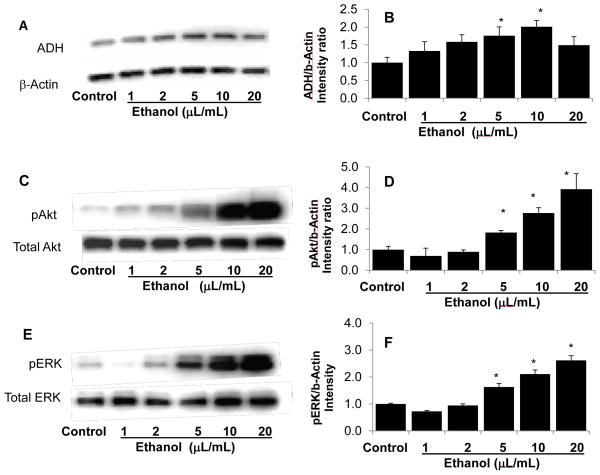
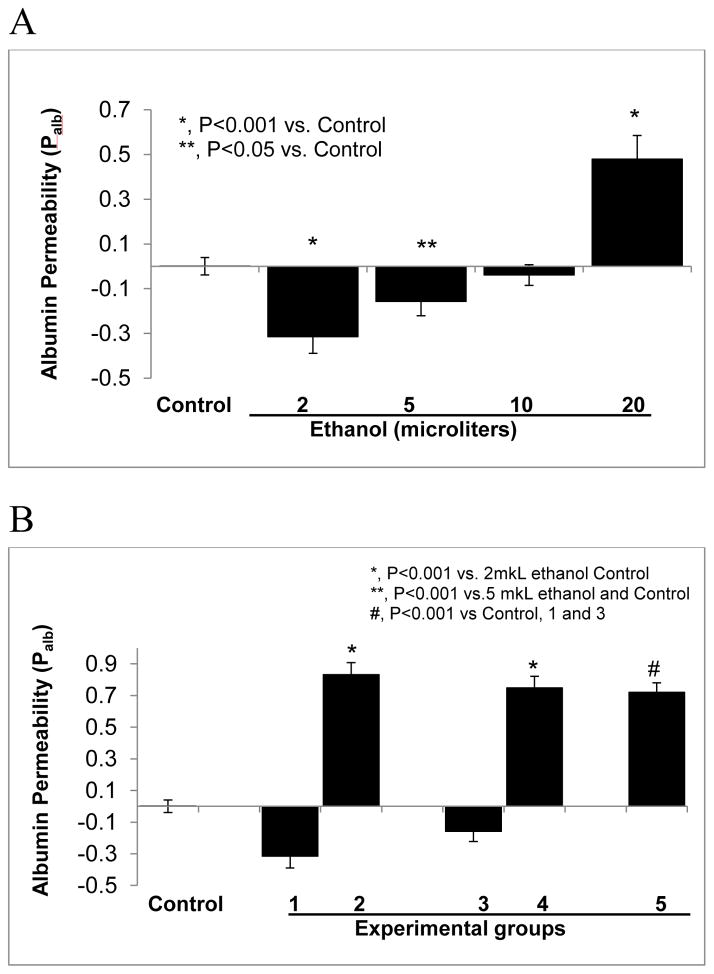
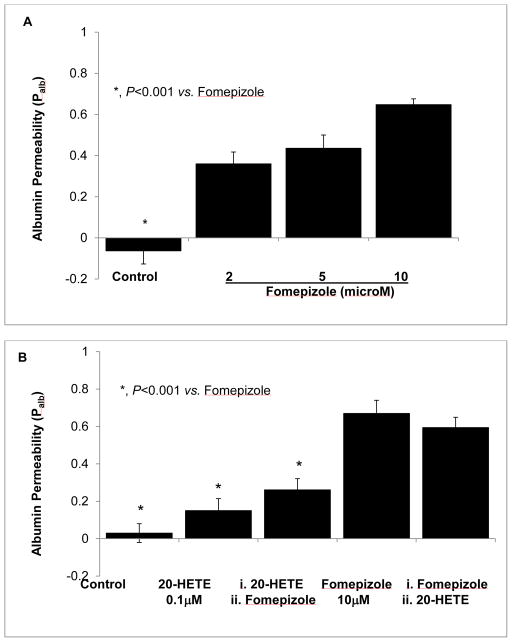
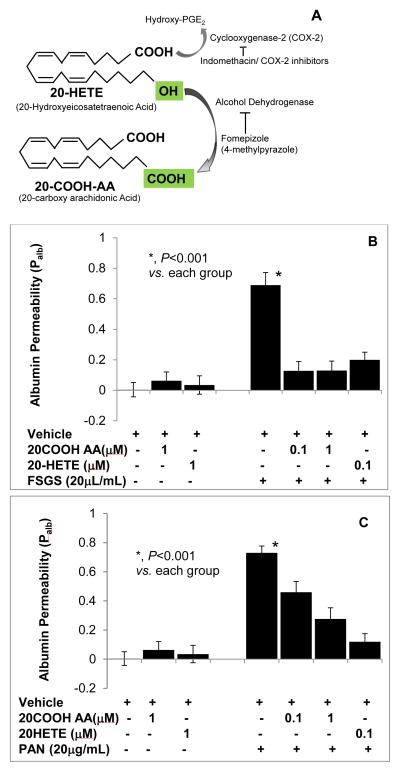
Clinical studies suggest cardiovascular and renal benefits of ingesting small amounts of ethanol. Effects of ethanol, role of alcohol dehydrogenase (ADH) or of 20-hydroxyeicosatetraenoic acid (20-HETE) in podocytes of the glomerular filtration barrier have not been reported. We found that mouse podocytes at baseline generate 20-HETE and express ADH but not CYP2e1. Ethanol at high concentrations altered the actin cytoskeleton, induced CYP2e1, increased superoxide production and inhibited ADH gene expression. Ethanol at low concentrations upregulated the expression of ADH and CYP4a12a. 20-HETE, an arachidonic acid metabolite generated by CYP4a12a, blocked the ethanol-induced cytoskeletal derangement and superoxide generation. Ethanol at high concentration or ADH inhibitor increased glomerular albumin permeability in vitro. 20-HETE and its metabolite produced by ADH activity, 20-carboxy-arachidonic acid, protected the glomerular permeability barrier against an ADH inhibitor, puromycin or FSGS permeability factor. We conclude that ADH activity is required for glomerular function, 20-HETE is a physiological substrate of ADH in podocytes and that podocytes are useful biosensors to understand glomeruloprotective effects of ethanol.

Keywords: 20-Carboxy-arachidonic acid; 20-Hydroxyeicosatetraenoic Acid; Alcohol dehydrogenase; Chronic kidney disease; Ethanol; Glomerular filtration barrier; Oxidative stress; Podocytes; Proteinuria.


Conflict of interest statement

CONFLICT OF INTEREST

None of the authors have any conflict of interest to declare regarding the contents of the paper.

Figures

FIGURE 1
FIGURE 1. Ethanol at high concentrations causes derangement of the actin cytoskeleton in podocytes
Differentiated podocytes were incubated with ethanol (0.02–0.4 mmol/mL) for 8 hr. Cells were stained for actin filaments using phalloidin and observed using confocal microscope. Representative images (63x objective) show that lower amounts of ethanol 0.04–0.1 mmol/mL did not alter the actin filament arrangement. A parallel arrangement of thick bundles running across the cell was maintained. Higher concentration of ethanol (0.2–0.4 mmol/mL) caused visible change in the thickness, length and arrangement of actin filaments. These changes were visible at 0.02 mmol/mL ethanol and a cortical ring like structure was observed at 0.4 mmol/mL ethanol. Pre-treatment of cells with 100 nm 2-HETE for 15 minutes before incubation with 0.4 mmol/mL ethanol prevented the cytoskeletal derangement.
FIGURE 2
FIGURE 2. Ethanol causes dose- and time-dependent apoptotic changes in podocytes
Control and ethanol-treated (0.2 or 0.4 mmol/mL) podocytes were stained using annexin V-FITC (x axis) and propidium iodide (y axis) at 6 and 24 hr and analyzed using flow cytometry. Data are presented as four quadrant distribution dot plots - Upper Left (UL), Upper Right (UR), Lower Left (LL) and Lower Right (LR). Combined data for late apoptosis and necrosis are presented (Late Apoptosis+Necrosis). Bar graphs summarize these observations at 6 and 24 hr that suggest increase in the number of apoptotic cells by 0.2 mmol/mL ethanol. Normal cells (LL): At 6 hr, normal cells were comparable in all groups (70–80% of total cell count). At 24 hr, Ethanol-treated groups showed 20% decrease compared to the control. Early Apoptosis (LR): Early apoptotic cells count was 79% (6h) and 16% (24h) higher than the time matched control in the 0.2 mmol/mL ethanol group. Cells showing early apoptosis in the ethanol-treated group (0.4 mmol/mL) were 13% (6h) higher and 25% (24h) lower than the control. Late Apoptosis+Necrosis (UL+UR): Ethanol 0.2 mmol/mL caused a decline in the number of these cells at 6 hr but a 29% increase over control by 24 hr. The 0.4 mmol/mL ethanol-treated group showed 23% (24h) higher number of cells with late apoptosis+necrosis compared to the control group. Values represent average of two separate experiments.
FIGURE 3
FIGURE 3. Ethanol increases superoxide generation in podocytes
A. Immortalized podocytes were incubated with ethanol 0.2 or 0.4 mmol/mL. Dihydroethidium (15 μM) was used to detect superoxide. Significant increase in fluorescence due to ethanol (0.2 or 0.4 mmol/mL) was detectable at 1, 4 and 24 hr compared to control. Fluorescence caused by 0.4 mmol/mL was significantly greater than that by 0.2 mmol/mL ethanol only at 1 hr (P<0.05, n=20 cells in two separate experiments). Ethanol at 0.2 and 0.4 mmol/mL caused significant increase in superoxide production at 1, 4 and 24 hr compared to the their respective control groups (*, P<0.05) B. Pre-treatment of cells with 100 nM 20-HETE blocked the effect of 0.2 mmol/mL ethanol on superoxide production at 4 hr (P<0.001 vs. ethanol treated group). C. Pre-treatment of cells with 100 nM 20-HETE blocked the effect of 0.4 mmol/mL ethanol on superoxide production at 4 hr (P<0.001 vs. ethanol treated group). D. Total RNA was prepared from untreated control and ethanol-treated podocytes (0.2 or 0.4 mmol/mL, 4 hr) and analyzed using RT-qPCR. CYP2e1 gene expression was significantly increased in podocytes treated with 0.4 mmol/mL (P<0.001 vs control). (n=4/group, each value represents average of 3 determinations).
FIGURE 4
FIGURE 4. Ethanol at high concentrations downregulates CYP4a12a gene expression
Differentiated podocytes were treated with 0.02–0.4 mmol/mL ethanol for 1, 8 and 24 hr. Numbers 1–5 indicate treatment groups in the bar graph. Thus, 1= 0.02; 2=0.04; 3=0.1; 4=0.2 and 5=0.4 mmol ethanol/mL. Total RNA was analyzed for CYP4a12a expression as described. GAPDH was used as the housekeeping gene control. Data calculated as ΔΔCt were normalized with GAPDH gene expression and average fold-change values of 4 replicate experiments are presented. Ethanol at 0.02, 0.04, 0.1 and 0.2 mmol/mL caused significant increase in CYP4a12a at 8 hr. Ethanol at 0.4 mmol/mL caused a significant decrease in CYP4a12a gene expression. (*, P<0.05 vs. control n=4 replicate experiments each analyzed in triplicates)
FIGURE 5
FIGURE 5. Ethanol at high concentrations down regulates ADH protein expression and up regulates Akt and ERK1/2 phosphorylation
Podocytes were incubated with ethanol (0.02–0.4 mmol/mL) for 1 hr at 37°C. Representative Western Blots and bar graphs of image intensity ratios (protein/β-actin ratios) are shown (mean±SEM). A and B. Ethanol-induced expression of total ADH in a dose-dependent manner that was noticeable at 0.04 mmol/mL and significantly increased at 0.1 and 0.2 mmol/mL ethanol (*, P<0.05, n=3) but not at 0.4 mmol/mL ethanol. C and D. Ethanol dose-dependently upregulated phosphorylation of Akt between 0.1 and 0.4 mmol/mL concentrations (P<0.05, n=5). Levels of total Akt protein expression remained unchanged. E and F. Ethanol dose-dependently upregulated phosphorylation of ERK 1/2 between 0.1 and 0.4 mmol/mL concentrations (P<0.05, n=5). Total ERK 1/2 protein expression did change.
FIGURE 6
FIGURE 6
Isolated rat glomeruli were incubated with (A) ethanol 0.02–0.4 mmol or with (B) 0.4 mmol/mL ethanol after pre-treatment with fomepizole (10 μM) for 15 minutes at 37°C. Palb was determined using an in vitro video-microscopy assay. A. Ethanol at 0.04 and 0.1 mmol/mL resulted in Palb lower than the control group (*, P<0.001 and **, P<0.05 vs. control, respectively). Palb after incubation with ethanol 0.2 mmol/mL was not different from control. However, Palb after incubation with ethanol at 0.4 mmol/mL increased significantly (*, P<0.001 vs. control, n= 15 glomeruli, 3 rats, 5 glomeruli from 1 rat in each group). B. Isolated glomeruli were incubated with ethanol alone, with fomepizole followed by ethanol or with fomepizole alone. Experimental groups are indicated by numbers 1–5. (1) Ethanol 0.04 mmol/mL, (2) 15 minute pre-incubation with 10μM fomepizole followed by addition of 0.04 mmol/mL ethanol and incubation for 15 minutes, (3) ethanol 0.1 mmol/mL, 15 minutes, (4) pre-incubation for 15 minutes with 10μM fomepizole followed by addition of 0.1 mmol/mL ethanol and incubation for 15 minutes (5) 10μM fomepizole for 15 minutes. Control glomeruli incubated in the medium for 15 minutes. Pre-treatment of glomeruli with fomepizole (10μM) blocked the effect of ethanol 0.04 or 0.1 mmol/mL (*, P<0.001 vs. ethanol alone groups) and increased Palb that was comparable to fomepizole alone (#, P<0.001 vs. control, n= 15 glomeruli, 3 rats, 5 glomeruli from each rat).
FIGURE 7
FIGURE 7. 20-HETE blocks fomepizole-induced increase in glomerular albumin permeability (Palb)
Isolated rat glomeruli were incubated with (A) fomepizole (2–10 μM) or with (B) 20-HETE (0.1 μM) for 15 minutes at 37°C. Palb was determined using an in vitro video-microscopy assay. A. Fomepizole increased glomerular Palb at 2 μM (P<0.001) and showed incremental effect with dose. n= 15 glomeruli, 3 rats (5 glomeruli from 1 rat) in each group, *, P<0.001 vs. fomepizole 2, 5 or 10 μM. B. Pre-treatment with 20-HETE (0.1 μM) for 15 minutes before adding fomepizole blocked the increase in Palb caused by fomepizole. However, adding 20-HETE 15 minute after fomepizole did not block the increase in Palb. n= 15 glomeruli, 3 rats (5 glomeruli from 1 rat) in each group, *, P<0.001 vs. fomepizole alone.
FIGURE 8
FIGURE 8. 20-HETE and its metabolite 20-COOH-arachidonic acid block the effect of FSGS factor or PAN on glomerular albumin permeability
Isolated rat glomeruli were incubated with 20-HETE (0.1 μM), 20-COOH-AA (0.1, 1 μM) followed by FSGS serum (20μL/mL) or by PAN (20 μg/mL) and incubated for 15 minutes. Change in Palb was determined using an in vitro assay. 20-HETE or 20-COOH-AA did not alter glomerular permeability. A. Schematic shows that 20-HETE is metabolized by ADH to form 20-COOH-AA that can be blocked by ADH inhibitor fomepizole. B. FSGS increased albumin permeability (P<0.001) and its effect was blocked by 20-HETE (0.1 μM) or 20-COOH-AA (0.1 μM). C. PAN increased albumin permeability (P<0.001). 20-HETE blocked the increase in permeability at 0.1 μM and 20-COOH-AA at 1 μM. n= 15 glomeruli, 3 rats (5 glomeruli from 1 rat) in each group, *, P<0.001.

References

    1. Lenfant C, Chobanian AV, Jones DW, Roccella EJ. Seventh report of the Joint National Committee on the Prevention, Detection, Evaluation, and Treatment of High Blood Pressure (JNC 7): resetting the hypertension sails. Hypertension. 2003;41:1178–9. - PubMed
    1. Thun MJ, Peto R, Lopez AD, Monaco JH, Henley SJ, Heath CW, Jr, et al. Alcohol consumption and mortality among middle-aged and elderly U.S. adults. N Engl J Med. 1997;337:1705–14. - PubMed
    1. Di Castelnuovo A, Costanzo S, Bagnardi V, Donati MB, Iacoviello L, de Gaetano G. Alcohol dosing and total mortality in men and women: an updated meta-analysis of 34 prospective studies. Arch Intern Med. 2006;166:2437–45. - PubMed
    1. Schaeffner E, Ritz E. Alcohol and kidney damage: a Janus-faced relationship. Kidney Int. 2012;81:816–8. - PubMed
    1. Greka A, Mundel P. Cell biology and pathology of podocytes. Annu Rev Physiol. 2012;74:299–323. - PMC - PubMed

Publication types

MeSH terms