. 2015 Jan 1;282(1):100-7.
doi: 10.1016/j.taap.2014.10.019. Epub 2014 Nov 7.

High level of oxygen treatment causes cardiotoxicity with arrhythmias and redox modulation

Affiliations

High level of oxygen treatment causes cardiotoxicity with arrhythmias and redox modulation

Kalyan C Chapalamadugu et al. Toxicol Appl Pharmacol. .

Abstract

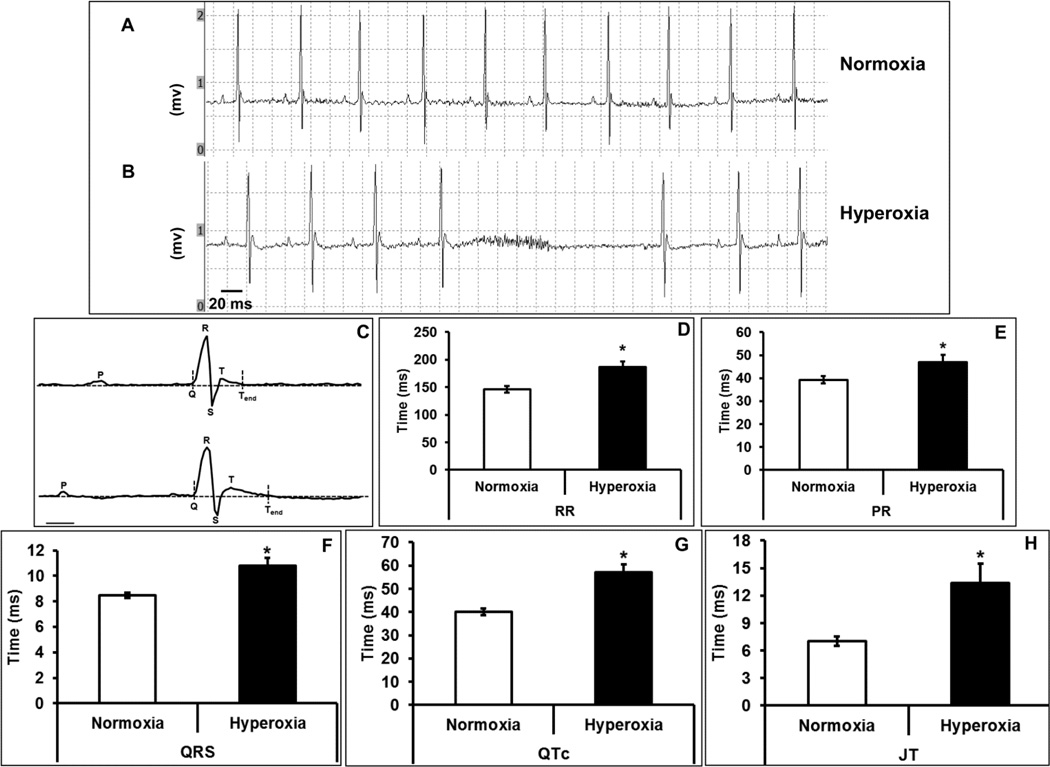
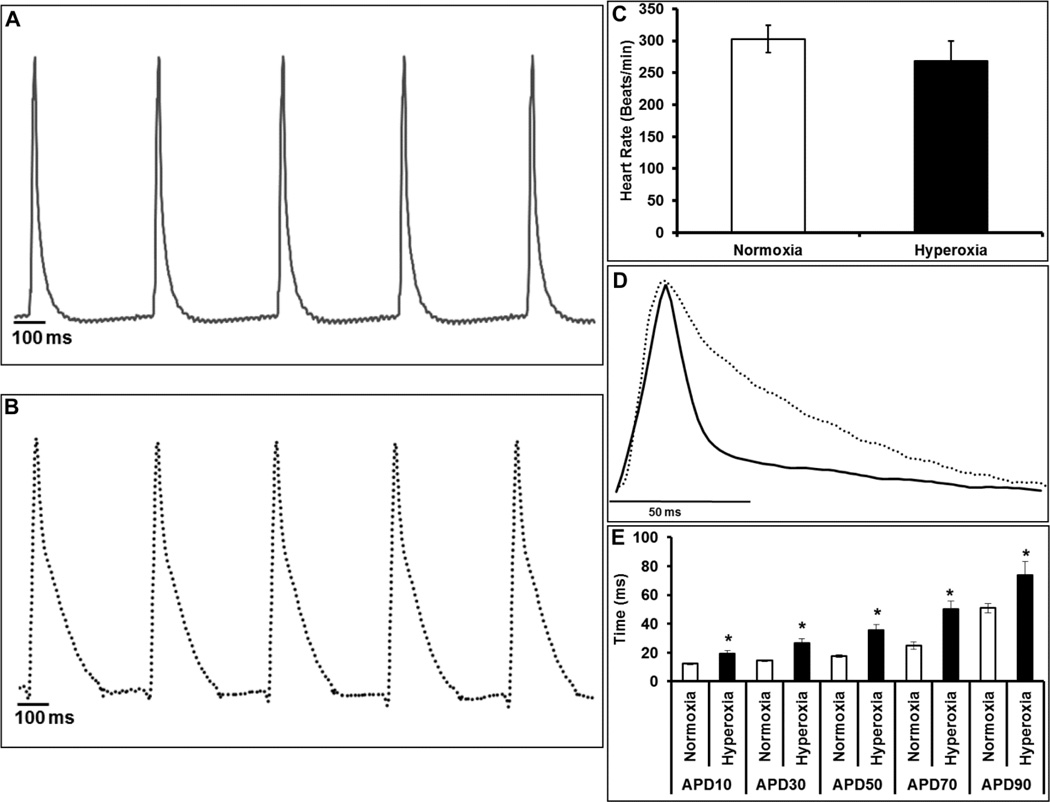
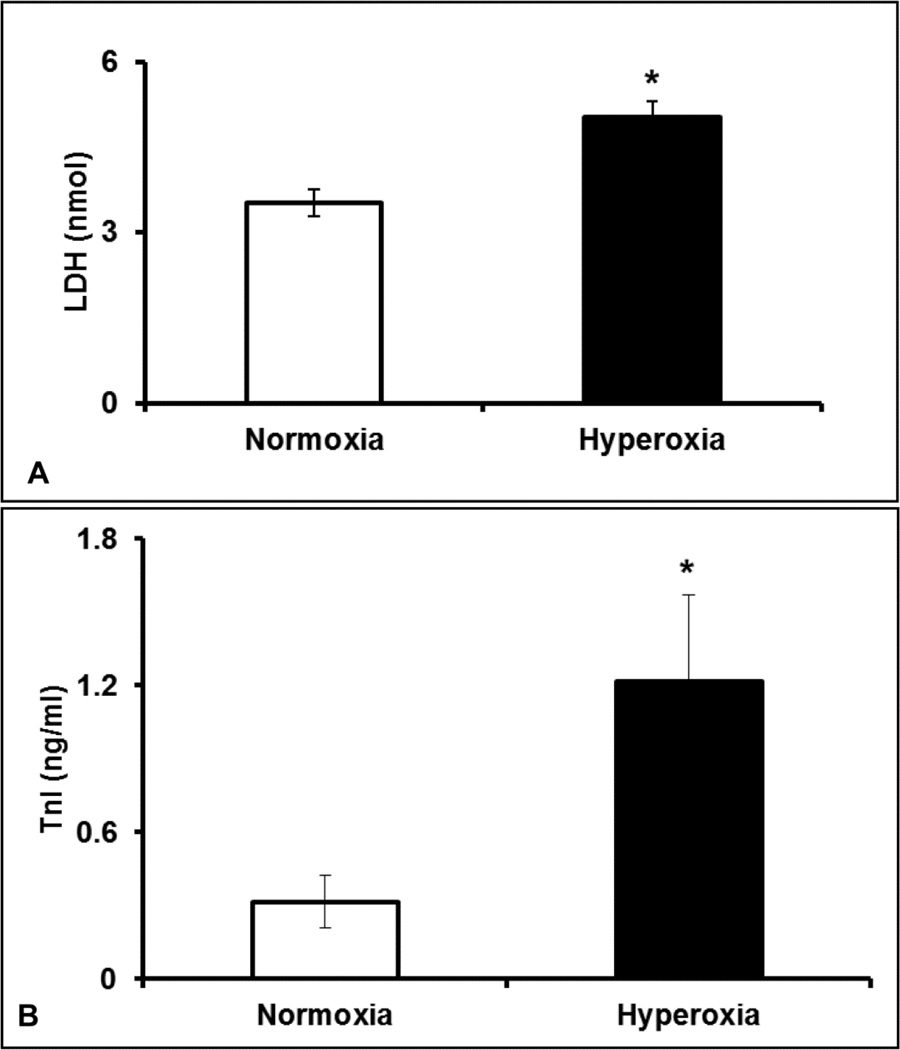
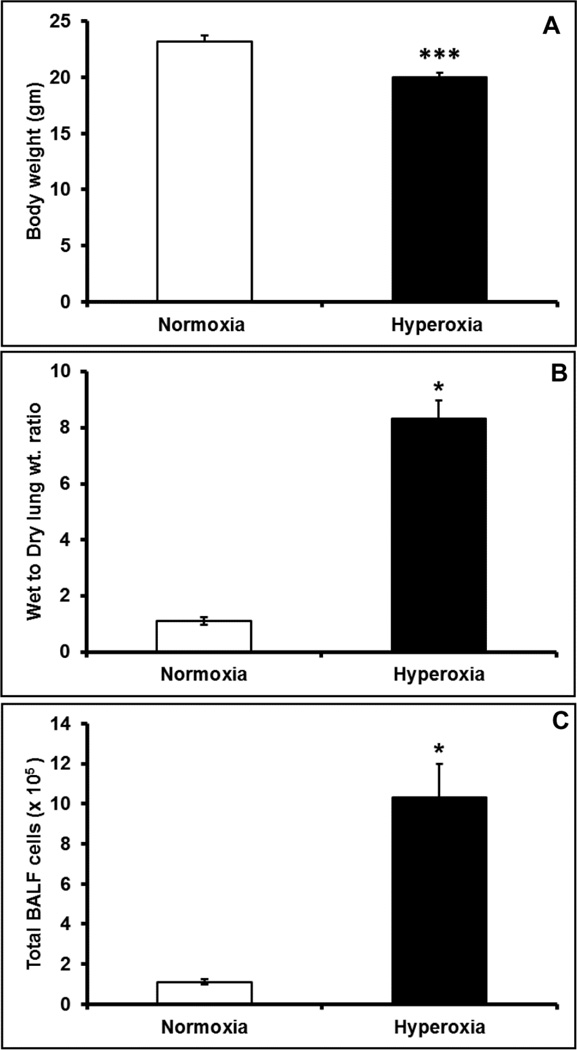
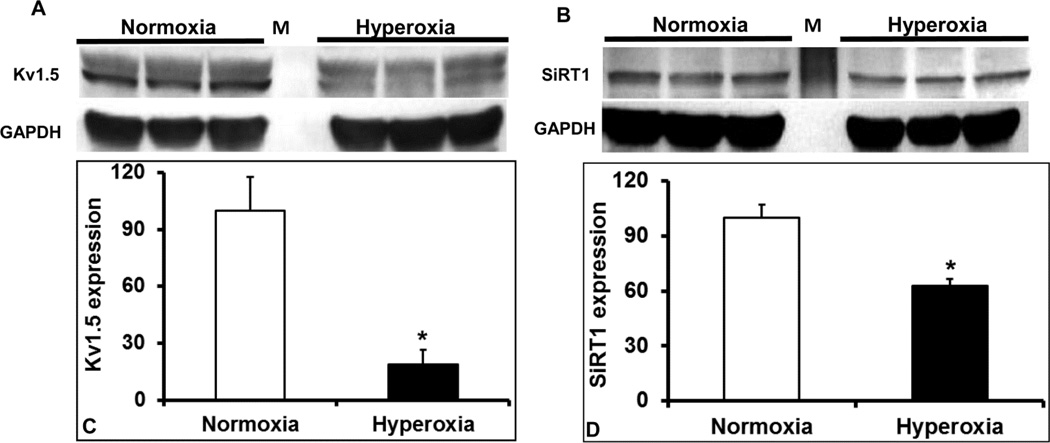
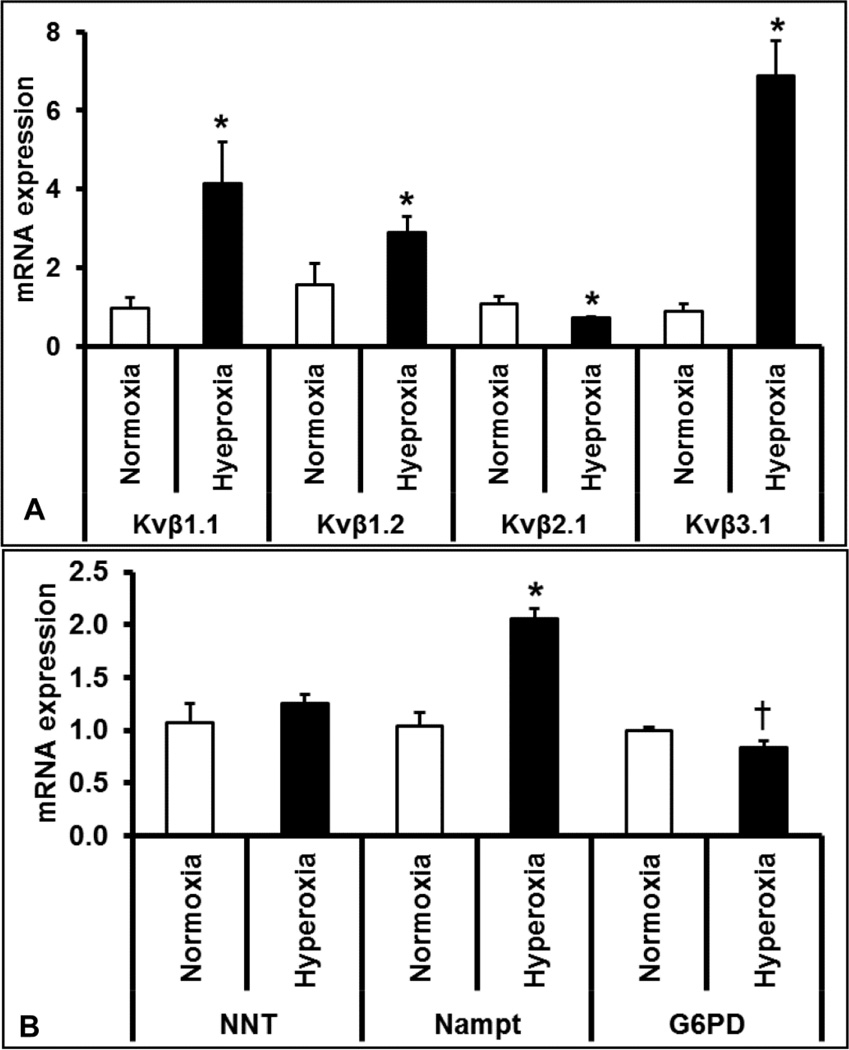
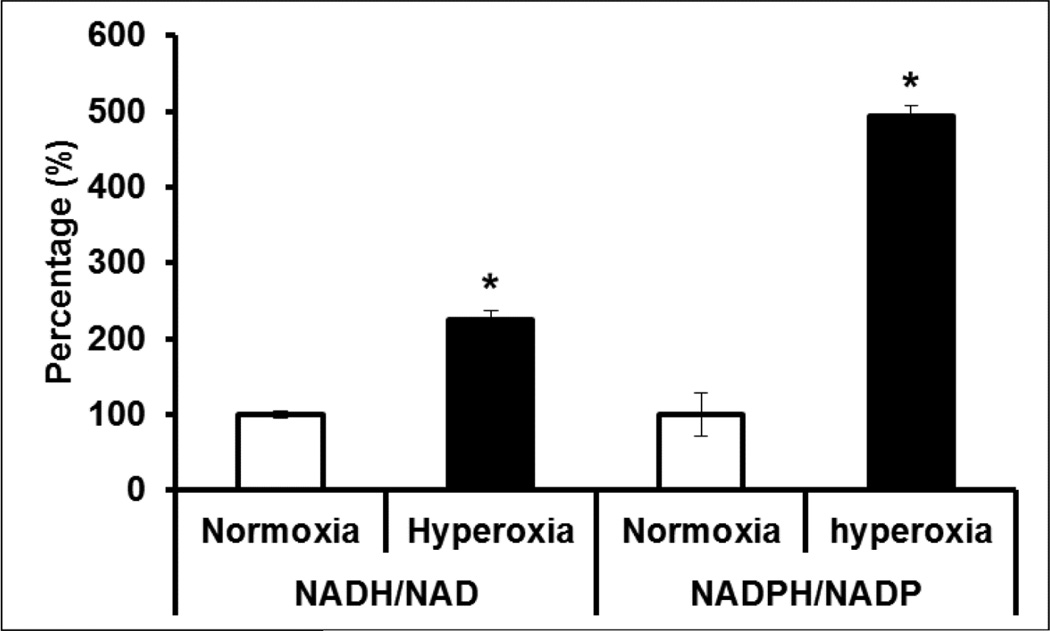
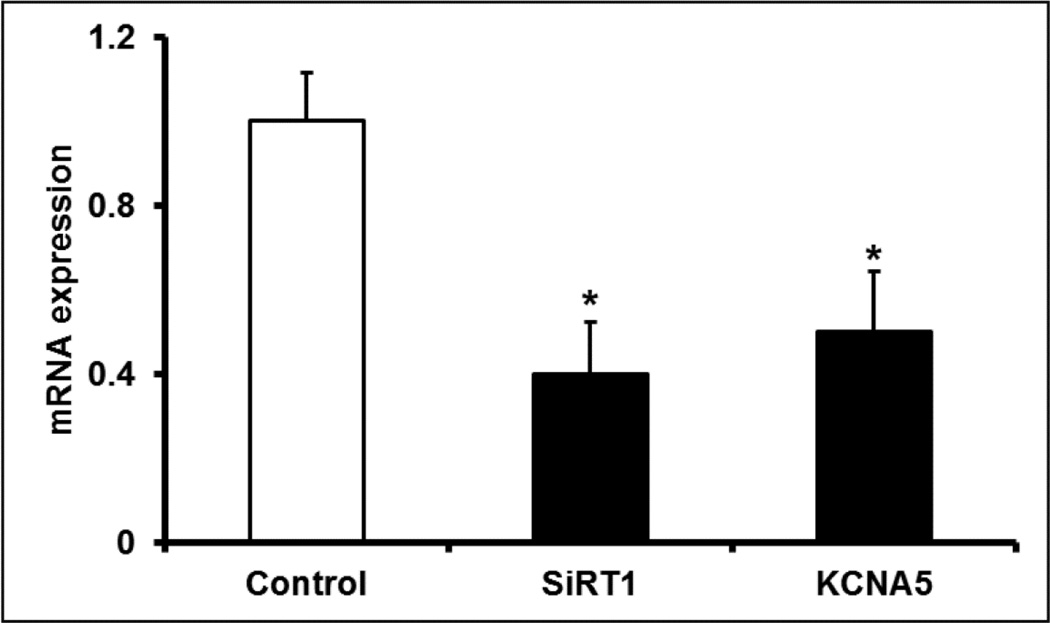
Hyperoxia exposure in mice leads to cardiac hypertrophy and voltage-gated potassium (Kv) channel remodeling. Because redox balance of pyridine nucleotides affects Kv function and hyperoxia alters cellular redox potential, we hypothesized that hyperoxia exposure leads to cardiac ion channel disturbances and redox changes resulting in arrhythmias. In the present study, we investigated the electrical changes and redox abnormalities caused by 72h hyperoxia treatment in mice. Cardiac repolarization changes were assessed by acquiring electrocardiogram (ECG) and cardiac action potentials (AP). Biochemical assays were employed to identify the pyridine nucleotide changes, Kv1.5 expression and myocardial injury. Hyperoxia treatment caused marked bradycardia, arrhythmia and significantly prolonged (ms) the, RR (186.2 ± 10.7 vs. 146.4 ± 6.2), PR (46.8 ± 3.1 vs. 39.3 ± 1.6), QRS (10.8 ± 0.6 vs. 8.5 ± 0.2), QTc (57.1 ± 3.5 vs. 40 ± 1.4) and JT (13.4 ± 2.1 vs. 7.0 ± 0.5) intervals, when compared with normoxia group. Hyperoxia treatment also induced significant increase in cardiac action potential duration (APD) (ex-APD90; 73.8 ± 9.5 vs. 50.9 ± 3.1 ms) and elevated levels of serum markers of myocardial injury; cardiac troponin I (TnI) and lactate dehydrogenase (LDH). Hyperoxia exposure altered cardiac levels of mRNA/protein expression of; Kv1.5, Kvβ subunits and SiRT1, and increased ratios of reduced pyridine nucleotides (NADH/NAD & NADPH/NADP). Inhibition of SiRT1 in H9C2 cells using Splitomicin resulted in decreased SiRT1 and Kv1.5 expression, suggesting that SiRT1 may mediate Kv1.5 downregulation. In conclusion, the cardiotoxic effects of hyperoxia exposure involve ion channel disturbances and redox changes resulting in arrhythmias.

Keywords: ECG; Heart; Hyperoxia; Kvβ; Potassium channel; Redox.


Conflict of interest statement

Conflict of interest statement:

The authors have no conflict of interests. No disclosures.

Figures

Figure 1
Figure 1. Hyperoxia leads to cardiac conduction abnormalities
Representative ECG (electrocardiogram) recording from normoxia (A) or hyperoxia (B) treated mice, C) analysis of ECG wave forms for normoxia and hyperoxia groups, D) RR interval, E) PR interval (F) QRS interval, (D) QTc interval and (E) JT interval. In the ECG chart recording, each division represents 20 ms on X-axis, and 0.5 mv on Y-axis (A and B). The scale bar denotes 10 ms for ECG recording in panel C. Bars represent mean time (ms) ± SEM of each group (n=8), *p ≤ 0.05.
Figure 2
Figure 2. Ventricular APD prolongation in hyperoxia exposed mice
Representative traces of monophasic action potentials from (A) normoxia (solid line) or (B) hyperoxia (dotted line) exposed hearts. Heart rate (C), overlay of the normalized representative trace from normoxia (solid line) and hyperoxia (dotted line) groups showing a change in the action potential waveform and duration (APD) (D), graph plot for action potential durations at various levels of repolarization; APD 10, 30, 50 and 90 (E). Bars represent mean ± SEM of each group (n=8), *p ≤ 0.05 normoxia vs. hyperoxia. The peak amplitudes were normalized to 1 and overlaid to depict action potential changes.
Figure 3
Figure 3. Elevated serum markers of myocardial injury in hyperoxia treated mice
Serum levels of Cardiac troponin I (TnI) (A) and LDH levels (B) in hyperoxia or normoxia exposed mice. Bars represent mean ± SEM of each group (n=8). Significant difference between the group averages was represented by an asterisk (*), p≤0.05.
Figure 4
Figure 4. Hyperoxia exposure resulted in decreased body weight and lung injury
Hyperoxia or normoxia exposed mice were assessed for (A) body weight changes, (B) Lung edema measured as wet to dry weight ratio and (C) total inflammatory cell infiltration in bronchioalveolar lavage (BAL). Bars represent mean ± SEM, n=6. All comparisons were considered significant when p≤0.05, and represented by an asterisk (*).
Figure 5
Figure 5. Western blots of transcriptional mediators and ion channel proteins in hyperoxia exposed hearts
Protein lysates of left ventricle of hyperoxia and normoxia exposed mice were assayed for changes in protein abundance of ion channel protein components, Kv1.5 (A) and transcription regulatory gene; SiRT1 (B). Densitometry values of each probed protein were normalized to GAPDH band of corresponding sample and reported as mean ± SEM (n=3) of normalized expression ratio of Kv1.5 (C) and SiRT1 (D). All comparisons were considered significant when p≤0.05 and represented by an asterisk (*).
Figure 6
Figure 6. Quantitative real-time PCR analysis of genes involved in pyridine nucleotide metabolism and Kv channel regulation
Total mRNA extracted from the left ventricle of hyperoxia and normoxia exposed mice were analyzed for expression changes of potassium channel (Kv) β subunits Kvβ1.1, Kvβ1.2, Kvβ2 and Kvβ3 (A) and redox modulator genes such as nicotinamide nucleotide transhydrogenase (NNT), Nicotinamide phosphoribosyltransferase (Nampt) and Glucose-6-phosphate-dehydrogenase (G6PD) (B). Expression of ribosomal 18s RNA was used as an endogenous reference gene. Bars represent mean ± SEM of mRNA fold changes in hyperoxia group as compared to normoxia group (n=3, p < 0.05). Significantly different groups were identified by an asterisk (*), and p=0.07 was indicated by a dagger (†).
Figure 7
Figure 7. Redox status of hyperoxia treated hearts
Ratio of NADPH/NADP and NADH/NAD were measured from hyperoxia or normoxia treated mouse hearts and data presented as percentage. Bars represent mean (±SEM) of n=6, *p≤0.05.
Figure 8
Figure 8. SiRT1 inhibition downregulates Kv1.5
H9C2 cells were treated for 48 h with SiRT1 inhibitor; Splitomicin (100 µM) or dimethyl sulfoxide, DMSO (control). RNA was extracted and SiRT1 and Kv1.5 mRNA expression was assessed by qRT-PCR. Ribosomal 18s RNA was used as an endogenous reference gene. Bars represent mean ± SEM (n=3), and * represents p≤0.05.

References

    1. Abdellatif M. Sirtuins and Pyridine Nucleotides. Circulation Research. 2012;111:642–656. - PMC - PubMed
    1. Amicarelli F, Ragnelli AM, Aimola P, Bonfigli A, Colafarina S, Di Ilio C, Miranda M. Agedependent ultrastructural alterations and biochemical response of rat skeletal muscle after hypoxic or hyperoxic treatments. Biochimica et Biophysica Acta (BBA) - Molecular Basis of Disease. 1999;1453:105–114. - PubMed
    1. Barry DM, Xu H, Schuessler RB, Nerbonne JM. Functional Knockout of the Transient Outward Current, Long-QT Syndrome, and Cardiac Remodeling in Mice Expressing a Dominant-Negative Kv4 Subunit. Circulation research. 1998;83:560–567. - PubMed
    1. Berul CI, Aronovitz MJ, Wang PJ, Mendelsohn ME. In Vivo Cardiac Electrophysiology Studies in the Mouse. Circulation. 1996;94:2641–2648. - PubMed
    1. Bin-Jaliah I, Dallak M, Haffor AS. Effect of hyperoxia on the ultrastructural pathology of alveolar epithelium in relation to glutathione peroxidase, lactate dehydrogenase activities, and free radical production in rats, Rattus norvigicus. Ultrastruct Pathol. 2009;33:112–122. - PubMed

Publication types

MeSH terms