. 2015 Feb;148(2):427-39.e16.
doi: 10.1053/j.gastro.2014.11.002. Epub 2014 Nov 7.

Alcohol disrupts levels and function of the cystic fibrosis transmembrane conductance regulator to promote development of pancreatitis

Affiliations

Alcohol disrupts levels and function of the cystic fibrosis transmembrane conductance regulator to promote development of pancreatitis

József Maléth et al. Gastroenterology. 2015 Feb.

Abstract

Background & aims: Excessive consumption of ethanol is one of the most common causes of acute and chronic pancreatitis. Alterations to the gene encoding the cystic fibrosis transmembrane conductance regulator (CFTR) also cause pancreatitis. However, little is known about the role of CFTR in the pathogenesis of alcohol-induced pancreatitis.

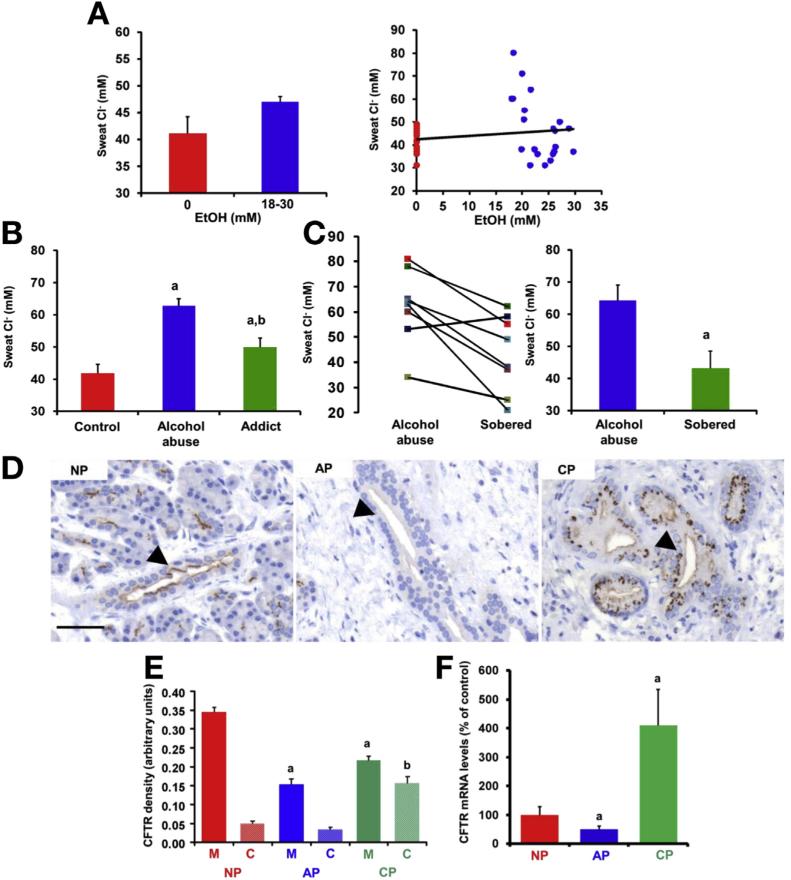
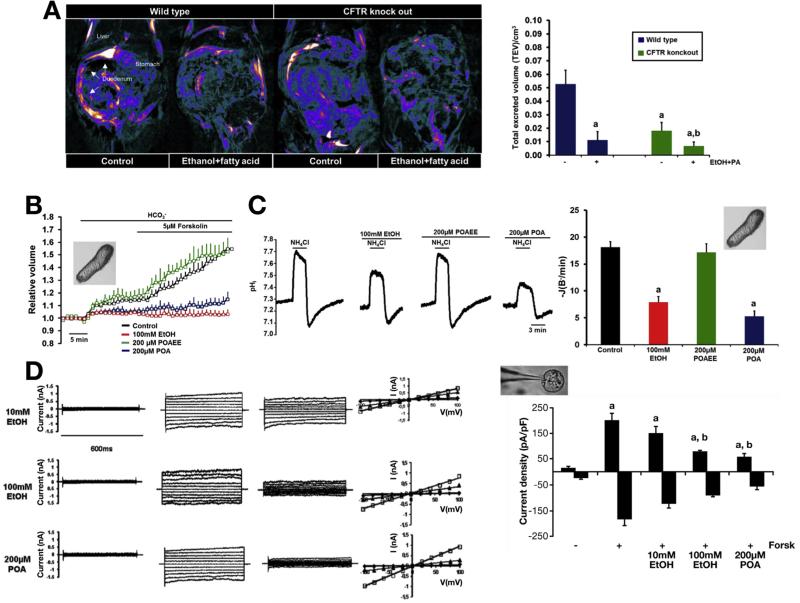
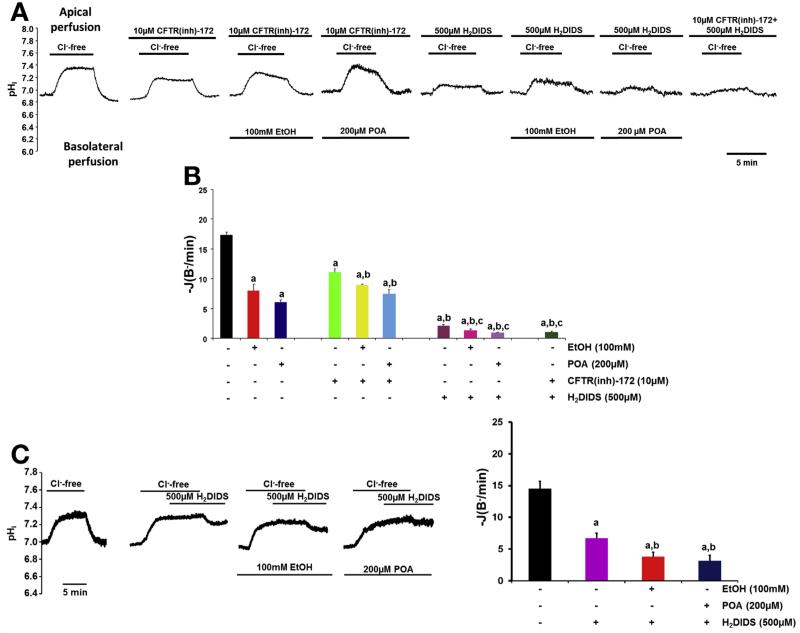
Methods: We measured CFTR activity based on chloride concentrations in sweat from patients with cystic fibrosis, patients admitted to the emergency department because of excessive alcohol consumption, and healthy volunteers. We measured CFTR levels and localization in pancreatic tissues and in patients with acute or chronic pancreatitis induced by alcohol. We studied the effects of ethanol, fatty acids, and fatty acid ethyl esters on secretion of pancreatic fluid and HCO3(-), levels and function of CFTR, and exchange of Cl(-) for HCO3(-) in pancreatic cell lines as well as in tissues from guinea pigs and CFTR knockout mice after administration of alcohol.

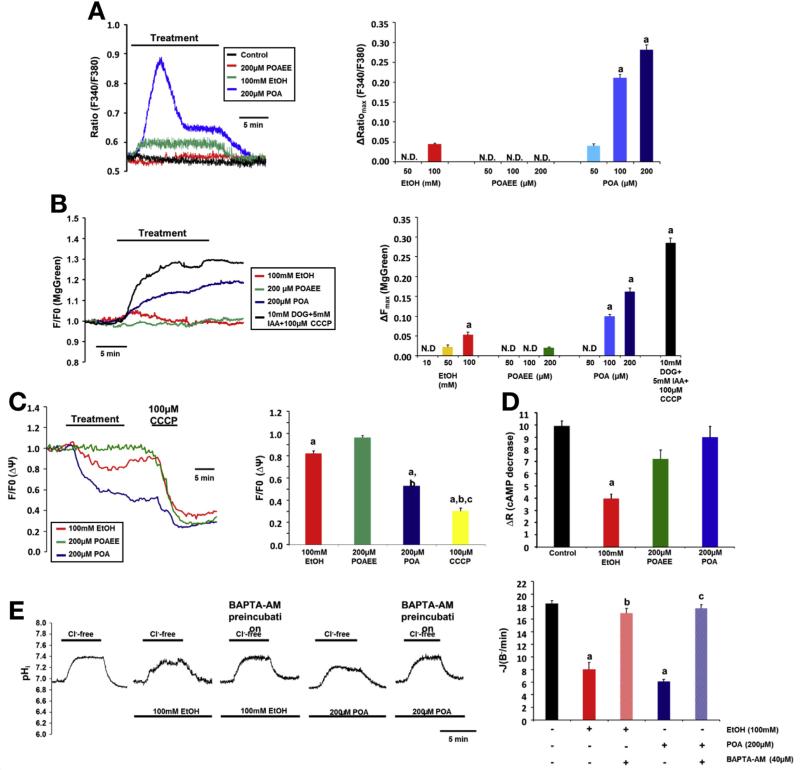
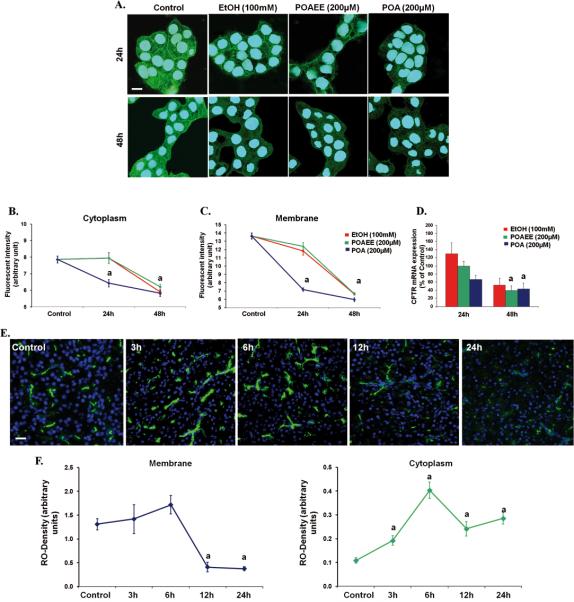
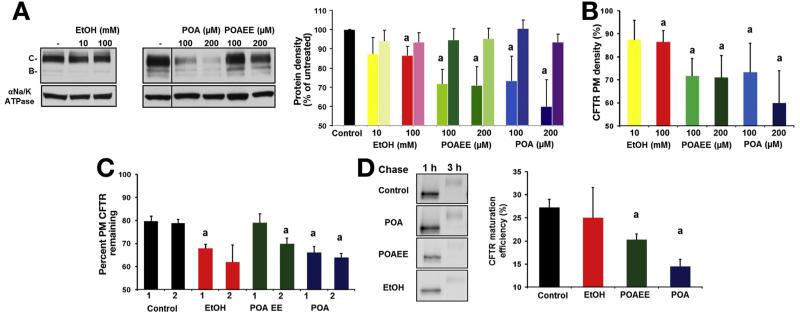
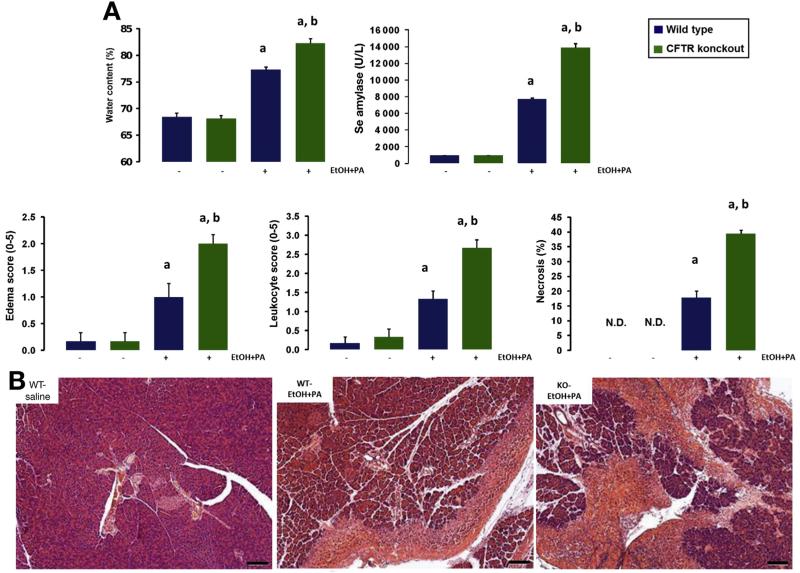
Results: Chloride concentrations increased in sweat samples from patients who acutely abused alcohol but not in samples from healthy volunteers, indicating that alcohol affects CFTR function. Pancreatic tissues from patients with acute or chronic pancreatitis had lower levels of CFTR than tissues from healthy volunteers. Alcohol and fatty acids inhibited secretion of fluid and HCO3(-), as well as CFTR activity, in pancreatic ductal epithelial cells. These effects were mediated by sustained increases in concentrations of intracellular calcium and adenosine 3',5'-cyclic monophosphate, depletion of adenosine triphosphate, and depolarization of mitochondrial membranes. In pancreatic cell lines and pancreatic tissues of mice and guinea pigs, administration of ethanol reduced expression of CFTR messenger RNA, reduced the stability of CFTR at the cell surface, and disrupted folding of CFTR at the endoplasmic reticulum. CFTR knockout mice given ethanol or fatty acids developed more severe pancreatitis than mice not given ethanol or fatty acids.

Conclusions: Based on studies of human, mouse, and guinea pig pancreata, alcohol disrupts expression and localization of the CFTR. This appears to contribute to development of pancreatitis. Strategies to increase CFTR levels or function might be used to treat alcohol-associated pancreatitis.

Keywords: Alcoholism; Cl(−) Channel; Duct; Exocrine Pancreas.


Figures

Figure 1
Figure 1
Alcohol consumption decreases activity and expression of the CFTR CI channel. (A) No significant change in CI sw was observed in healthy volunteers (n=21) before and after ethanol consumption. (B) CI sw was significantly higher in patients after excessive alcohol consumption (EAC) compared with age- and sex-matched controls, whereas it was elevated in alcoholic subjects with 0 mmol/L BAC (Addict) compared with the control group but significantly lower than in the alcohol abuse group. Control, n = 26; EAC, n = 49; Addict, n = 15. aP < 0.001 vs control, bP < .001 vs EAC. (C) The CI sw of patients returned to a normal level when measured several days after EAC at 0 mmol/L BAC. n 8. aP < .001 vs EAC values. (D and E) CFTR expression in human pancreas. Arrows point to the luminal membrane of the intralobular pancreatic ducts. NP, normal pancreas. Scale bar = 50 μm. CFTR staining density at the luminal membrane was decreased in both AP and CP, whereas cytoplasmic density was markedly increased in CP. C, cytoplasm; M, membrane. n = 5/group. aP < .05 vs NP-M, bP < .05 vs NP-C. (F) Quantitative polymerase chain reaction analysis of CFTR mRNA expression in human pancreas. CFTR mRNA levels were decreased in AP and highly increased in CP (normalized to 18 ribosomal RNA; given as percentage of NP mRNA). n = 5/group. aP < .05 vs NP.
Figure 2
Figure 2
Ethanol and fatty acids inhibit pancreatic fluid and HCO3 secretion and CFTR CI current. (A) Reconstructed images of duodenal filling after secretin stimulation. Compared with WT, duodenal filling was significantly reduced in CFTR KO mice and was abolished after intraperitoneal injection of ethanol plus palmitic acid. n = 6/group. aP < .05 vs WT control, bP < .05 vs KO control. (B) Changes in the relative luminal volume of isolated guinea pigpancreatic ducts show that administration of ethanol and POA but not POAEE for 30 minutes diminished in vitro ductal fluid secretion. n = 3–4 experiments per group. (C) Measurement of luminal CI/HCO3 exchange activity shows that basolateral administration of 100 mmol/L ethanol and 200 μmol/L POA significantly inhibited activity of the luminal SLC26 CI /HCO3 exchanger and CFTR and decreased recovery from the alkali load in isolated guinea pig pancreatic ducts. n = 3–5 experiments per group. aP < .05 vs control. (D) Representative fast whole cell CFTR CI current recordings in guinea pig pancreatic ductal cells. (i) Unstimulated currents, (ii) currents after forskolin stimulation (10 μmol/L; 10 minutes), (iii) stimulated currents after 10 minutes of treatment, and (iv) current-voltage relationships (diamonds, unstimulated; squares, forskolin stimulated; triangles, forskolin-stimulated currents after treatment). The summary of the current densities (pA/pF; measured at Erev: ±60 mV) show that 100 mmol/L ethanol or 200 μmol/L POA blocked the forskolin-stimulated CFTR CI currents (61.5% ± 5.15% and 73.1% ± 4.46%, respectively). n = 5–6/group. aP < .05 vs basal current, bP < .05 vs forskolin-stimulated current.
Figure 3
Figure 3
Ethanol and POA inhibit both the luminal CI /HCO3 exchanger and CFTR in Capan-1 cells. (A and B) The initial rate of intracellular pH (pHi) recovery after luminal CI readdition shows the effects of basolateral administration of 100 mmol/L ethanol or 200 μmol/L POA in the presence or absence of 500 μmol/L H2DIDS and/or 10 μmol/L CFTR(inh)-172 (luminal administration). (Labels above the traces, composition of the luminal solution; labels below the traces, composition of the basolateral solution.) A total of 100 mmol/L ethanol and 200 mmol/L POA induced further inhibition after administration of CFTR(inh)-172 and/or H2DIDS, suggesting that high concentrations of ethanol and POA inhibit the activity of CBE and CFTR on the apical membrane of PDECs. aP < .05 vs control, bP < .05 vs 10 mmol/L CFTR(inh)-172, cP < .05 vs 500 μmol/L H2DIDS. (C) Representative pHi traces and summary data of the initial rate of pHi recovery after CI readdition using a different protocol confirmed our results. aP < .05 vs control . n = 3–5 experiments per group for all groups.
Figure 4
Figure 4
High concentrations of ethanol and POA induce sustained elevation of [Ca2+]i, impaired mitochondrial function, and decreased cAMP levels in Capan-1 PDECs. (A) Representative traces and summary data of the ΔRatiomax show the effect of ethanol, POAEE, and POA on [Ca2+]i. Ethanol (100 mmol/L) induced a small, sustained elevation of [Ca2+]i, whereas 100 to 200 μmol/L POA induced a significantly higher increase in [Ca2+]i. aP < .05 vs 100 mmol/L ethanol. (B) Ethanol and POA induced significant and irreversible depletion of (ATP)i. Deoxyglucose/iodoacetic acid (DOG/IAA; glycolysis inhibition) and CCCP (inhibition of mitochondrial ATP production) served as control. (C) Representative traces and summary data of changes in the mitochondrial membrane potential [(ΔΨ)m]. Ethanol (100 mmol/L) induced a moderate decrease in (δΨ)m, whereas 200 μmol/L POA had a more prominent effect. CCCP induced a further decrease in (δΨ)m after treatment with POA. (D) Summary data for cAMP measurements. A total of 100 mmol/L ethanol and 200 μmol/L POAEE significantly decreased forskolin-stimulated cAMP production. (E) Ca2+ chelation abolished the inhibitory effect of ethanol and POA on intracellular pH recovery after luminal CI readdition. For all conditions, n = 3–5/group. aP < .05 vs control; bP < .05 vs 100 mmol/L ethanol; cP < .05 vs 200 μmol/L POA. N.D., not detected.
Figure 5
Figure 5
Ethanol, POAEE, and POA decrease CFTR expression in Capan-1 cells and in guinea pig pancreatic ducts. (AC) High concentrations of ethanol, POAEE, and POA induced a significant decrease in CFTR membrane and cytoplasmic expression. Scale bar = 10 μm. (D) Ethanol, POAEE, and POA decreased CFTR mRNA expression after 48 hours of Data were normalized to HPRT mRNA levels and expressed as percentage of untreated control mRNA levels. (E and F) CFTR expression in guinea pig pancreas. Expression of CFTR on the luminal membrane of guinea pig pancreatic was significantly decreased 12 hours after a single intraperitoneal injection of 0.8 g/kg ethanol and 300 mg/kg PA. Scale bar = 100 μm. n = 5/group. aP < vs control.
Figure 6
Figure 6
Effect of ethanol and its metabolites on CFTR and Na+/K+-ATPase expression. (A) Immunoblotting and densitometry of CFTR and Na+/K+-ATPase expression levels in transfected MDCK monolayers after 48 hours of treatment with ethanol, POA, or POAEE (right panel). Results are expressed as percentage of the complex glycosylated CFTR (band C) or Na+/K+-ATPase expression in untreated cells (control). (First column, CFTR; second column, Na+/K+-ATPase for each condition.) (B) Enzyme-linked immunosorbent assay measurement of the apical plasma membrane (PM) density of CFTR revealed that ethanol, POA, and POAEE decreased this parameter after 48 hours of incubation. Results are presented as percentage of CFTR cell surface density of the untreated cells. (C) Ethanol, POAEE, and POA reduce the PM stability of CFTR determined by cell surface enzyme-linked immunosorbent assay. Cell surface resident CFTR was labeled with anti-HA antibody and chased for 1 or 2 hours in the presence of the indicated compounds at 37 C. Results are presented as percentage of the initial CFTR surface density (1 and 2 indicate 1-hour and 2-hour chase, respectively). (D) CFTR folding efficiency was reduced by 100 mmol/L ethanol and diminished by 200 μmol/L POA or POAEE after 48 hours. CFTR folding efficiency was calculated as the percentage of the pulse-labeled, core glycosylated form converted into the mature complex glycosylated form during 3-hour chase. n = 3 for each condition. aP < .05 vs control.
Figure 7
Figure 7
AP induced by ethanol and fatty acids is more severe in CFTR KO mice. (A) Induction of AP by a single intraperitoneal injection of ethanol and PA induced significant elevation of pancreatic water content as measured by 100 * (wet weight dry – weight)/wet weight), serum amylase activity, edema and leukocyte scores, and necrosis. The severity of pancreatitis was significantly higher in CFTR KO mice. (B) Representative H&E-stained light micrographs of pancreas sections from WT control and ethanol + PA–treated WT or CFTR KO mice. Note the massive necrosis in the treated animals. Scale bars = 100 μm. Data are shown as means ± SEM. aP < .05 vs control, bP < .05 vs WT ethanol + PA–treated group. n = 6/group. N.D., not detected.

Comment in

References

    1. Yadav D, Lowenfels AB. The epidemiology of pancreatitis and pancreatic cancer. Gastroenterology. 2013;144:1252–1261. - PMC - PubMed
    1. Nagar AB, Gorelick FS. Acute pancreatitis. Curr Opin Gastroenterol. 2002;18:552–557. - PubMed
    1. Braganza JM, Lee SH, McCloy RF, et al. Chronic pancreatitis. Lancet. 2011;377:1184–1197. - PubMed
    1. Pandol SJ, Lugea A, Mareninova OA, et al. Investigating the pathobiology of alcoholic pancreatitis. Alcohol Clin Exp Res. 2011;35:830–837. - PMC - PubMed
    1. Petersen OH, Tepikin AV, Gerasimenko JV, et al. Fatty acids, alcohol and fatty acid ethyl esters: toxic Ca2+ signal generation and pancreatitis. Cell Calcium. 2009;45:634–642. - PubMed

Publication types

MeSH terms