. 2014 Nov 17;24(22):2693-9.
doi: 10.1016/j.cub.2014.09.050. Epub 2014 Oct 30.

Nonpolitical images evoke neural predictors of political ideology

Affiliations

Nonpolitical images evoke neural predictors of political ideology

Woo-Young Ahn et al. Curr Biol. .

Abstract

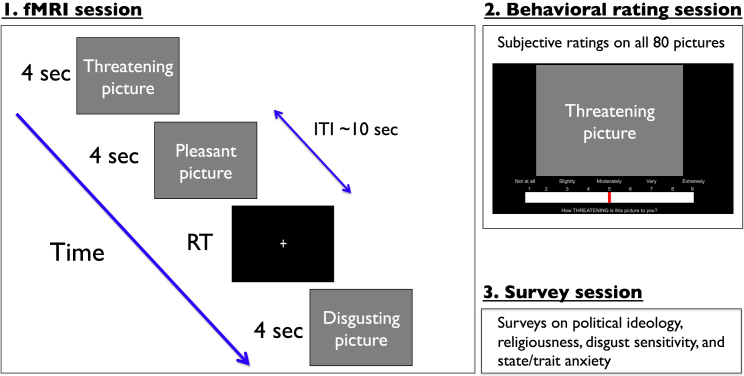
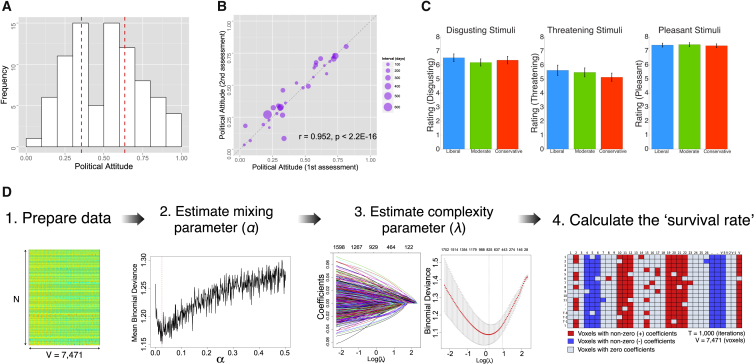
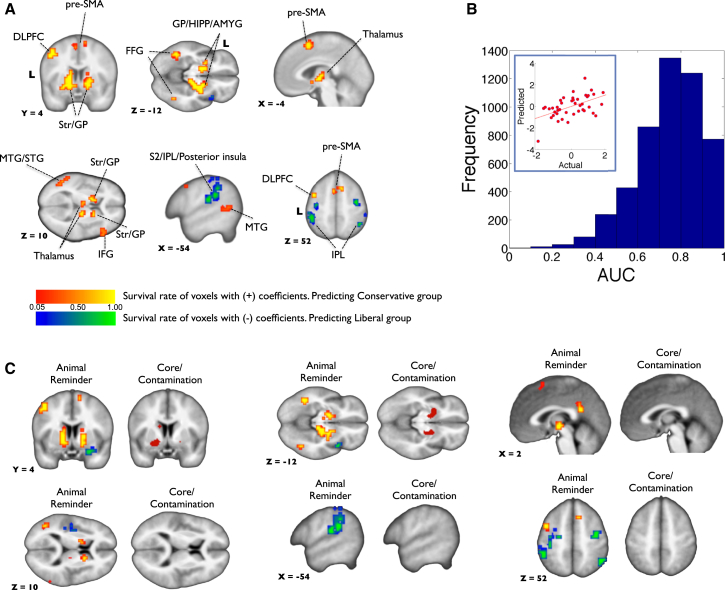
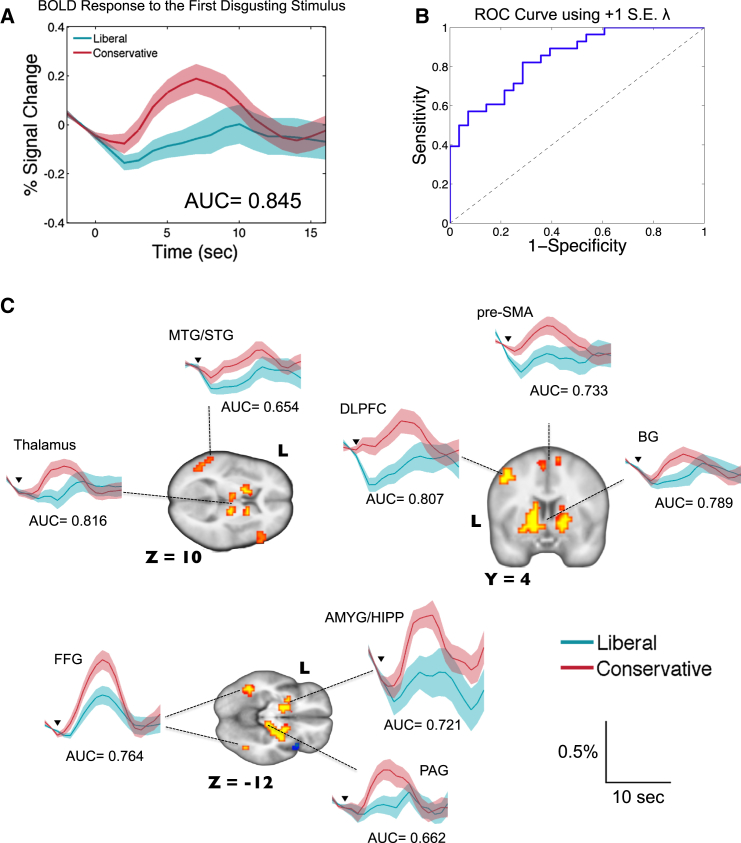
Political ideologies summarize dimensions of life that define how a person organizes their public and private behavior, including their attitudes associated with sex, family, education, and personal autonomy. Despite the abstract nature of such sensibilities, fundamental features of political ideology have been found to be deeply connected to basic biological mechanisms that may serve to defend against environmental challenges like contamination and physical threat. These results invite the provocative claim that neural responses to nonpolitical stimuli (like contaminated food or physical threats) should be highly predictive of abstract political opinions (like attitudes toward gun control and abortion). We applied a machine-learning method to fMRI data to test the hypotheses that brain responses to emotionally evocative images predict individual scores on a standard political ideology assay. Disgusting images, especially those related to animal-reminder disgust (e.g., mutilated body), generate neural responses that are highly predictive of political orientation even though these neural predictors do not agree with participants' conscious rating of the stimuli. Images from other affective categories do not support such predictions. Remarkably, brain responses to a single disgusting stimulus were sufficient to make accurate predictions about an individual subject's political ideology. These results provide strong support for the idea that fundamental neural processing differences that emerge under the challenge of emotionally evocative stimuli may serve to structure political beliefs in ways formerly unappreciated.


Figures

Figure 1
Figure 1
Time Course of the Experiment Each subject first participated in an affective picture-viewing task in the fMRI scanner, during which they viewed 80 color pictures (20 disgusting, 20 threatening, 20 pleasant, and 20 neutral pictures). Occasionally, a fixation cross appeared on the screen, and participants were asked to press a button as soon as they saw the cross. Each picture was presented for 4 s, and the fixation cross was presented until participants pressed a button. The mean intertrial interval (ITI) was 10 s. Next, participants completed a behavioral rating session and several computerized surveys (see the Supplemental Experimental Procedures). See also Figure S1.
Figure 2
Figure 2
Behavioral Results and an Illustration of Workflow for Penalized Regression Analysis (A) Distribution of political attitudes (orientation). Political attitudes are scaled from 0 (extremely liberal) to 1 (extremely conservative) (mean = 0.500, SD = 0.225). We divided participants (n = 83) into three groups (liberal [n = 28], moderate [n = 27], and conservative [n = 28]) based on their political attitudes. Red dotted lines indicate tertiles (33.3% and 66.6%). (B) Test-retest reliability of political attitudes. The Pearson correlation coefficient is 0.952, p < 2.2 × 10−16, and the robust correlation coefficient is 0.986, p < 2.0 × 10−16. (C) Subjective ratings of emotional pictures for each group. Error bars indicate ±1 SE. (D) Schematic illustration of workflow for a machine-learning (penalized-regression) model. A 10-fold cross-validation is used to estimate two tuning parameters of the elastic net model. The survival rate was projected back into the brain space (see the Supplemental Experimental Procedures and Figure S3A). See also Figure S3.
Figure 3
Figure 3
Multivariate Patterns of Brain Activity that Predict Political Ideology (A) Voxels predicting conservative (red-to-yellow) or liberal (blue-to-green) group membership from penalized logistic regression analysis (cluster size, k ≥ 10). Survival rate is closely related to voxel (regression) weights (see Figure S3B). DLPFC, dorsolateral prefrontal cortex; pre-SMA, presupplementary motor area; Str, striatum; GP, globus pallidus; HIPP, hippocampus; AMYG, amygdala; MTG/STG, middle/superior temporal gyrus; IFG, inferior frontal gyrus; S2, secondary somatosensory cortex; IPL, inferior parietal lobule; and FFG, fusiform gyrus. The color scale denotes the survival rate. (B) Distribution of cross-validated area under the curve (AUC). We ran 1,000 iterations of 5-fold cross-validation procedure. For each iteration, we first found the λ that minimized the out-of-sample binomial deviance of four folds (80% of the data). Then, for each of the five folds, we computed the area under the receiver-operating characteristic (ROC) curve using predictions from the model fit to the remaining data using the minimum λ. This resulted in the 5,000 (1,000 iterations × 5 AUCs per iteration) AUC calculations plotted in the histogram (mean = 0.757, median = 0.771, mode = 0.833, SD = 0.150). The inset in the top-left corner shows out-of-sample prediction performance on the half of the data (test set) when the model is trained on the other half of the data (training set) for penalized linear regression. The x and y axes show the Z scores of actual political attitudes and predicted political attitudes from BOLD signals, respectively. Pearson correlation coefficient = 0.52, p = 0.0004; robust correlation coefficient = 0.44, p = 0.0024. See the Supplemental Experimental Procedures for complete details. (C) Voxels predicting conservative or liberal group membership from each subcondition of disgust (i.e., using contrast maps of [animal-reminder disgust > neutral] or [core/contamination disgust > neutral]; see the Supplemental Experimental Procedures for the details of subconditions). The voxel survival criterion is the same as that for (A). See also Figure S2.
Figure 4
Figure 4
Single Presentation of a Disgusting Stimulus Is Sufficient to Make Accurate Predictions of Individual’s Political Orientation (A) Hemodynamic response to the first disgusting stimulus for the liberal and conservative groups, extracted from the red-to-yellow voxels in Figure 3A. Shaded regions indicate ±1 SE. Time-series data were linearly interpolated every 1 s for display purposes. “AUC” indicates the mean AUC of ROC curves over 1,000 iterations. (B) A representative ROC curve. (C) Hemodynamic response to the first disgusting stimulus, extracted from each predictive region, as well as the mean AUCs of the corresponding ROC curves. The x axis is time since stimulus presentation (s) and the y axis is the percent signal change (percentage). Black inverse triangles indicate the stimulus onset, the bottom of which is at 0.05% signal change. DLPFC, dorsolateral prefrontal cortex; pre-SMA, presupplementary motor area; BG, basal ganglia; AMYG/HIPP, amygdala/hippocampus; MTG/STG, middle/superior temporal gyrus; FFG, fusiform gyrus; and PAG, periaqueductal gray. See also Figure S4.

Similar articles

Cited by

References

    1. Jost J.T., Federico C.M., Napier J.L. Political ideology: its structure, functions, and elective affinities. Annu. Rev. Psychol. 2009;60:307–337. - PubMed
    1. Haidt J. Pantheon; New York: 2012. The Righteous Mind: Why Good People Are Divided by Religion and Politics.
    1. Fowler J.H., Baker L.A., Dawes C.T. Genetic variation in political participation. Am. Polit. Sci. Rev. 2008;102:233–248.
    1. Alford J.R., Funk C.L., Hibbing J.R. Are political orientations genetically transmitted? Am. Polit. Sci. Rev. 2005;99:153–167.
    1. Hatemi P.K., Gillespie N.A., Eaves L.J., Maher B.S., Webb B.T., Heath A.C., Medland S.E., Smyth D.C., Beeby H.N., Gordon S.D. A genome-wide analysis of liberal and conservative political attitudes. J. Polit. 2011;73:271–285.

Publication types

LinkOut - more resources