Review
. 2015 Jan:27:115-135.
doi: 10.1016/j.ymben.2014.09.007. Epub 2014 Oct 31.

Review of methods to probe single cell metabolism and bioenergetics

Affiliations
Review

Review of methods to probe single cell metabolism and bioenergetics

Andreas E Vasdekis et al. Metab Eng. 2015 Jan.

Abstract

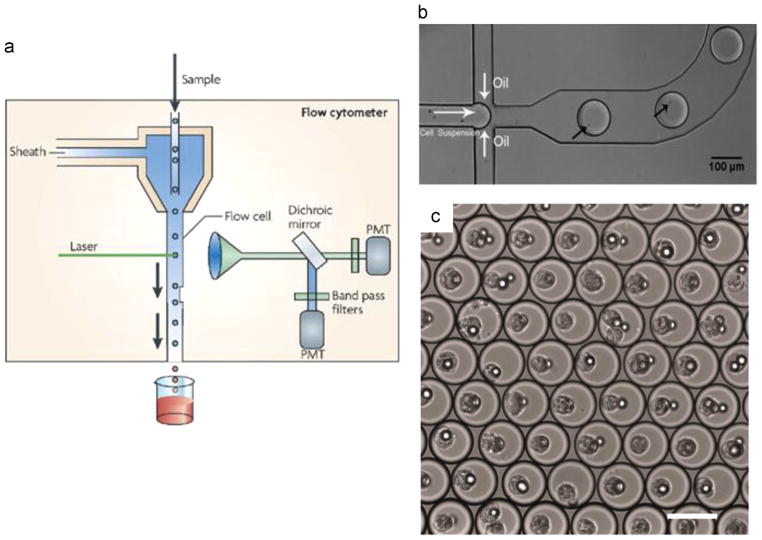
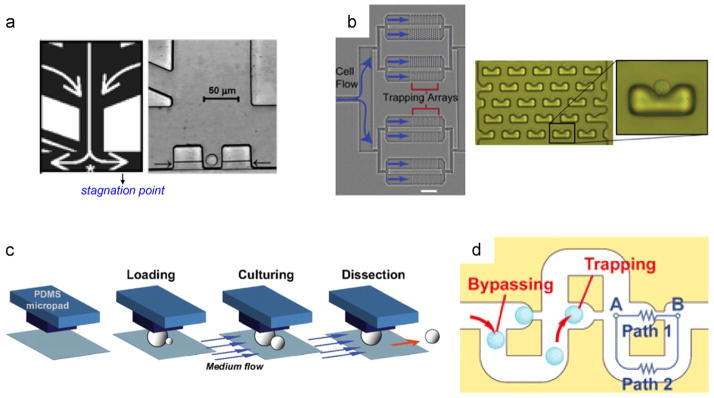
Single cell investigations have enabled unexpected discoveries, such as the existence of biological noise and phenotypic switching in infection, metabolism and treatment. Herein, we review methods that enable such single cell investigations specific to metabolism and bioenergetics. Firstly, we discuss how to isolate and immobilize individuals from a cell suspension, including both permanent and reversible approaches. We also highlight specific advances in microbiology for its implications in metabolic engineering. Methods for probing single cell physiology and metabolism are subsequently reviewed. The primary focus therein is on dynamic and high-content profiling strategies based on label-free and fluorescence microspectroscopy and microscopy. Non-dynamic approaches, such as mass spectrometry and nuclear magnetic resonance, are also briefly discussed.

Keywords: Bioenergetics; Metabolism; Microfluidics; Microscopy; Single cell analysis.


Figures

Fig. 1
Fig. 1. From many down to the single cell
(a) An industrial scale fermenter with an approximate height of a few meters (credit U.S. Department of Energy). (b) A bioreactor growing algae; the vertical dimension of the instrument is a few cm containing approximately 1012 cells (credit U.S. Department of Energy). (c) A budding Yarrowia lipolytica yeast, with the daughter cell exhibiting an approximate 2 μm diameter. (c) Schematic representations of the 2D, 1D and 0D confinement types discussed in this review.
Fig. 2
Fig. 2. Flow-through single cell analysis
(a) The schematic of a conventional single cell flow cytometer is illustrated (Reprinted by permission from Macmillan Publishers Ltd.: Nature Reviews Microbiology (Barnett et al., 2008), Copyright (2008). (b) Loading of single cells in droplets at a microfluidic T-junction; the black arrows point to the individual cell in the droplet (reproduced from Pan et al. (2011) with permission from The Royal Society of Chemistry). (c) Single hybridoma cell encapsulation in arrested droplets (reprinted by permission from Macmillan Publishers Ltd.: Nature Protocols (Mazutis et al., 2013), Copyright (2013).
Fig. 3
Fig. 3. Confinement in 3D microcavities
(a) A schematic of the fabrication and seeding of PDMS microwell arrays. The procedure involves pouring and curing the prepolymer on to a patterned master and subsequently peeling off and placing the microwells in a Petri dish; finally, the cell suspension is introduced and allowed to sediment onto the microwells and excess cells from the top surface are rinsed (reprinted from Rettig and Folch (2005); Copyright (2005) American Chemical Society). (b) An SEM image of single trapped Jurkat T cells in an array of cell retainers etched in SiO2; scale bar is 20 μm (reproduced from Deutsch et al. (2006) with permission from The Royal Society of Chemistry). (c) Mammalian cells trapped in microwell arrays at the bottom of a microfluidic channel; the microwells are the circular structures and the microfluidic channel walls are denoted by the straight lines (reproduced from Khademhosseini et al. (2004) with permission from The Royal Society of Chemistry).
Fig. 4
Fig. 4. 2D and 1D confinement
A zoomed-in view of the Tesla microchemostat (a), illustrating the ‘diode loop’ with the trapping (gray) and loading (black) regions; (b) the shallow trapping region of Tesla microchemostat is shown, where cells are confined in 2D; the scale bar is 20 μm (Cookson et al., 2005) (Copyright©2005 EMBO and Nature Publishing Group). (c) A bioreactor with a shallow circular 2D growth area placed inside a deeper supply channel; note the radially arranged channels that enable nutrient supply and waste removal (reproduced from Gruenberger et al. (2012) with permission from The Royal Society of Chemistry). (d) 1D bacterial growth in 1D patterned agarose (lower) in contrast to agarose pads were bacterial crowding takes place (upper); reproduced from Moffitt et al. (2012) with permission from The Royal Society of Chemistry.
Fig. 5
Fig. 5. 0D confinement
(a) Microfluidic single cell trapping (left), where cells are trapped at the stagnation point and kept there immobilized by flow driven hydrostatic pressure (denoted by white arrows). A bright field image of an individual trapped Jurkat T-cell (right); adapted from Wheeler et al. (2003); Copyright (2003) American Chemical Society. (b) A single cell trapping array is illustrated (left, scale bar is 500 μm); a higher resolution image of the trapping array (middle), along with an individual trapped cell (right); reproduced from Di Carlo et al. (2006) with permission from The Royal Society of Chemistry. (c) Monolithic PDMS pads for trapping yeast cells, while releasing the daughter cells under the continuous flow of media (adapted from Lee et al. (2012)). (d) A schematic diagram of a microfluidic ‘lateral percolation’ trap; the operation principle is based on the geometric relationship between paths 1 and 2. When the trap is empty, the resistance of path 1 is lower until a cell occupies, after which subsequent cells will follow the bypass loop (adapted from Tan and Takeuchi (2007)); Copyright (2007) National Academy of Sciences, USA).
Fig. 6
Fig. 6. Dynamic confinement 1
(a) A schematic representation of a pneumatically isolated microcavity; cell trapping occurs by compressing the flow channel by the two control channels (reprinted by permission from Macmillan Publishers Ltd.: Nature (Cai et al., 2006), Copyright (2006). (b) A fluorescently labeled E. coli trapped inside a submicrofluidic indentation; release takes place by increasing the flow rate (reproduced from Vasdekis (2013) with permission from The Royal Society of Chemistry). (c) A single cell hydrodynamic trap by generating microeddies around a solid cylinder at low frequency oscillations of flow (reproduced from Lutz et al. (2006); Copyright (2006) American Chemical Society). (d) A stagnation point generated at the junction of two perpendicular microchannels; active feedback flow control ensures the stabilization of the stagnation point and the immobilization of a single cell therein (reprinted with permission from Tanyeri et al. (2010)); Copyright (2010), AIP Publishing LLC).
Fig. 7
Fig. 7. Dynamic confinement 2
Schematic representation of single cell trapping by OT (a) and a ‘dual beam trap’ (b). (c) Radiation pressure forces enable selective release of microwell loaded cells (reproduced from Kovac and Voldman (2007)); Copyright (2007) American Chemical Society). (d) DEP trapping of a Pollen grain in an eight electrode electric field cage (reprinted from Schnelle et al. (1993)) Copyright (1993), with permission from Elsevier). (e) The cell loading and retrieval is illustrated for the magnetic microrafts (reprinted with permission from Gach et al. (2011)); Copyright (2011), AIP Publishing LLC).
Fig. 8
Fig. 8. Label-free microanalysis
(a) Single cell proliferation in a microchemostat (reprinted from Nobs and Maerkl (2014)). (b) The Raman spectrum of a bacterium is plotted, including the major bands attributions (reprinted from Schuster et al. (2000); Copyright (2000) American Chemical Society). (c) Raman images of yeast at different wavenumber regions, marking specific intracellular molecular fractions (adapted from Rosch et al. (2005); Copyright©2005 John Wiley & Sons, Ltd.). In (d) a multiplex SRS image of single algal cells, depicting photosynthetic pigments (red), lipids (green) and protein (blue); (adapted from Fu et al. (2012)); Copyright (2000) American Chemical Society). (e) Elemental maps from X-ray emission of the marine species D. norvegica using a nuclear microprobe at a 5 μm spatial resolution (adapted from Gisselson et al. (2001)). (f) A budding yeast cell imaged by soft X-ray tomography, where different colors represent different organelles (adapted from Parkinson et al. (2008); Copyright 2014 by the Association for the Sciences of Limnology and Oceanography, Inc.). (For interpretation of the references to color in this figure legend, the reader is referred to the web version of this article.)
Fig. 9
Fig. 9. Fluorescence mediated microanalysis
(a) Chromophore classes found in fluorescent proteins and their respective emission bands (reprinted by permission from Macmillan Publishers Ltd.: Nature Chemical Biology (Dean and Palmer, 2014), Copyright (2014). (b) A phosphorescent oxygen sensor at the bottom of a microwell plate containing two cells (reprinted from Molter et al. (2009), Copyright (2009), with permission from Elsevier). (c) Population heterogeneity in the production of L-valine, revealed by an FP-fused genetically encoded biosensor (reproduced from Mustafi et al. (2014)). (d) Microfluidic high-throughput screening platform of secreted metabolites in microfluidic droplets; reprinted by permission from Macmillan Publishers Ltd.: Nature Biotechnology (Wang et al., 2014), Copyright (2014).
Fig. 10
Fig. 10. Mass spectrometry
Sequential clips illustrating the metabolic analysis of single cells using nano-electrospray ionization (ESI–MS); in this instance, video microscopy enables the selective analysis of the cytoplasm (a) or individual granules (b); reprinted from Mizuno et al. (2008); Copyright©2008 John Wiley & Sons, Ltd. (c) Schematic illustrating the NanoSIMS imaging of a single cell: the secondary ion beam rasters over the sample removes material to be analyzed by MS. Quantitative raster NanoSIMS images of the R. palustris bacterium, illustrating the distribution of 12C (d) and 13C (e); image (f) illustrates the 13C enrichment at one pole of the cells (reproduced from Doughty et al. (2014)).

References

    1. Acar M, Becskei A, van Oudenaarden A. Enhancement of cellular memory by reducing stochastic transitions. Nature. 2005;435 (7039):228–232. - PubMed
    1. Agresti JJ, et al. Ultrahigh-throughput screening in drop-based microfluidics for directed evolution. Proc Natl Acad Sci USA. 2010;107 (9):4004–4009. - PMC - PubMed
    1. Aharoni A, et al. High-throughput screening of enzyme libraries: thiolactonases evolved by fluorescence-activated sorting of single cells in emulsion compartments. Chem Biol. 2005;12(12):1281–1289. - PubMed
    1. Ahluwalia BS, et al. Optical trapping and propulsion of red blood cells on waveguide surfaces. Opt Express. 2010;18 (20):21053–21061. - PubMed
    1. Andersson H, van den Berg A. Microfluidic devices for cellomics: a review. Sens Actuators B – Chem. 2003;92(3):315–325.

Publication types

MeSH terms