Review
. 2015 Jun;111(Pt B):161-9.
doi: 10.1016/j.visres.2014.10.002. Epub 2014 Oct 16.

Cortical magnification plus cortical plasticity equals vision?

Affiliations
Review

Cortical magnification plus cortical plasticity equals vision?

Richard T Born et al. Vision Res. 2015 Jun.

Abstract

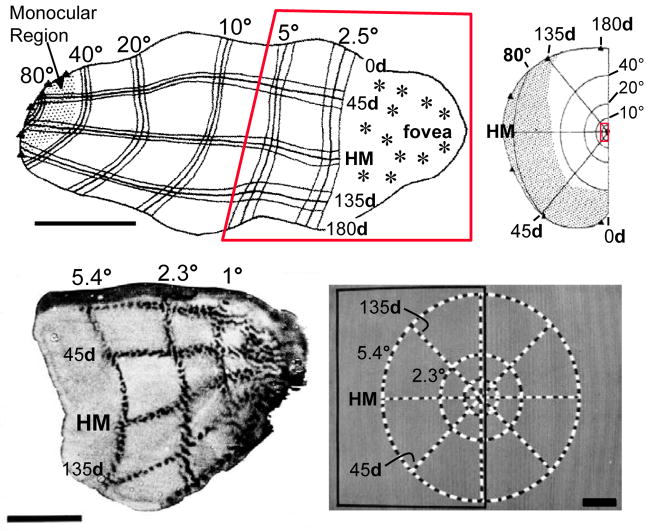
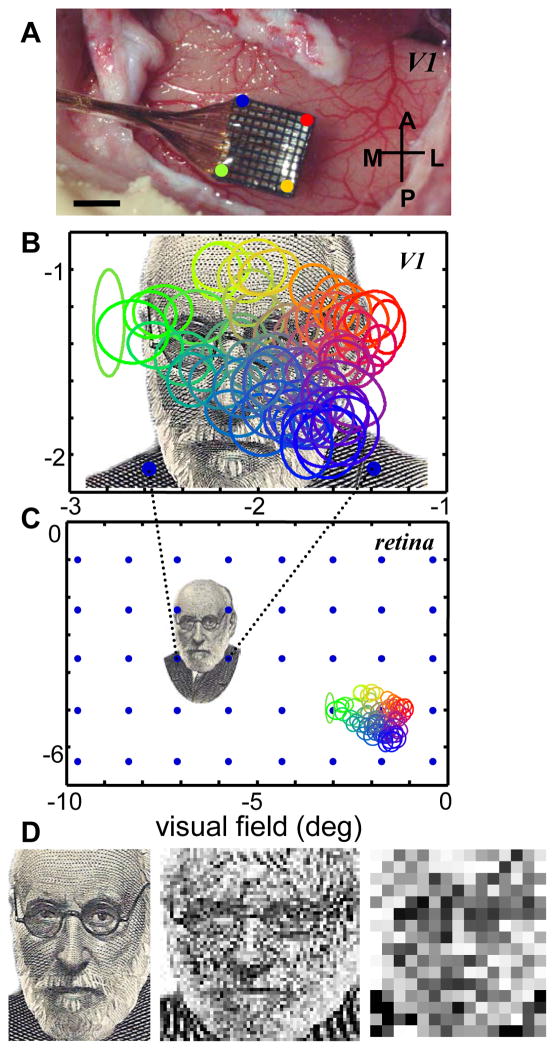
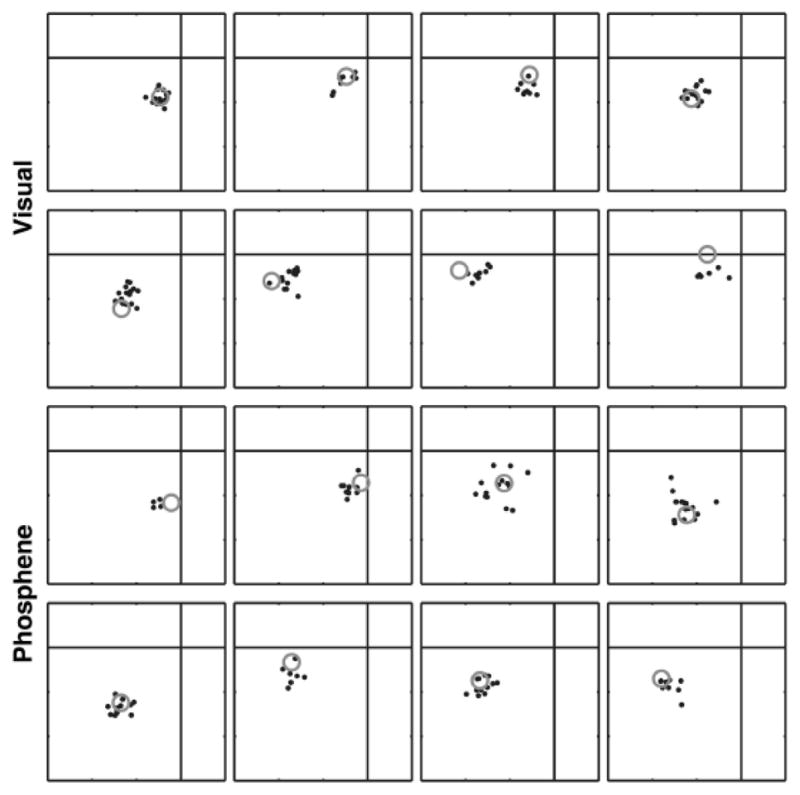
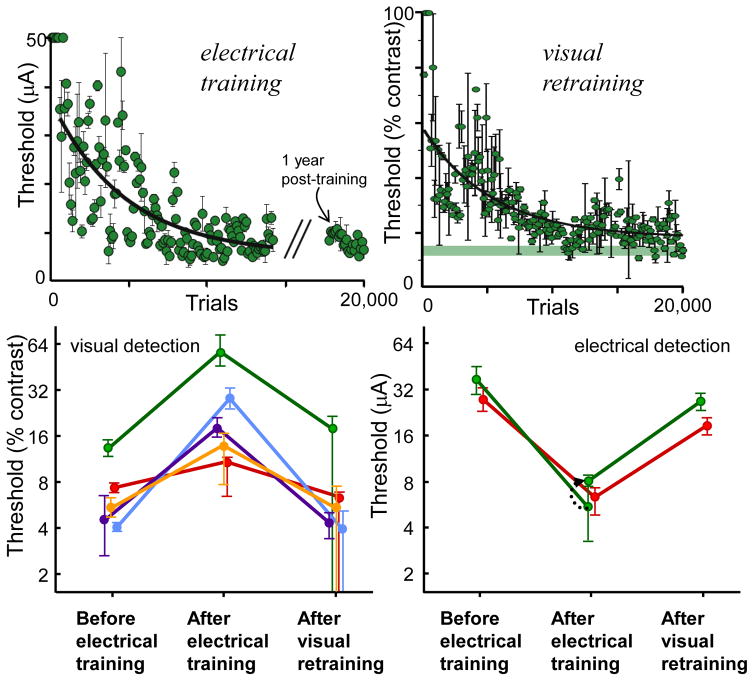
Most approaches to visual prostheses have focused on the retina, and for good reasons. The earlier that one introduces signals into the visual system, the more one can take advantage of its prodigious computational abilities. For methods that make use of microelectrodes to introduce electrical signals, however, the limited density and volume occupying nature of the electrodes place severe limits on the image resolution that can be provided to the brain. In this regard, non-retinal areas in general, and the primary visual cortex in particular, possess one large advantage: "magnification factor" (MF)-a value that represents the distance across a sheet of neurons that represents a given angle of the visual field. In the foveal representation of primate primary visual cortex, the MF is enormous-on the order of 15-20 mm/deg in monkeys and humans, whereas on the retina, the MF is limited by the optical design of the eye to around 0.3m m/deg. This means that, for an electrode array of a given density, a much higher-resolution image can be introduced into V1 than onto the retina (or any other visual structure). In addition to this tremendous advantage in resolution, visual cortex is plastic at many different levels ranging from a very local ability to learn to better detect electrical stimulation to higher levels of learning that permit human observers to adapt to radical changes to their visual inputs. We argue that the combination of the large magnification factor and the impressive ability of the cerebral cortex to learn to recognize arbitrary patterns, might outweigh the disadvantages of bypassing earlier processing stages and makes V1 a viable option for the restoration of vision.

Keywords: Magnification factor; Plasticity; Primary visual cortex; V1; Vision restoration; Visual prosthesis.


Figures

Figure 1
Figure 1
Retinotopic organization of macaque primary visual cortex. Top. Topography of V1 mapped with microelectrode recordings, from Van Essen et al. 1984. Bottom. Topography of peri-foveal V1 mapped using 2-deoxyglucose functional labeling, from Tootell et al. 1988. Scale bars: top left, 1 cm.; bottom left, 1 cm.; bottom right, 2°. For clarity, polar angles in degrees use the “d” symbol, whereas distances in the visual field in degrees use “°”.
Figure 2
Figure 2
Cortical versus retinal magnification factors. A. A 10 x 10 multi-electrode array (MEA) implanted in primary visual cortex of a macaque monkey. Scale bar, 2 mm. B. Receptive field (RF) map of the MEA shown in the top panel. Each ellipse is the 2-standard deviation size of a 2-dimensional Gaussian fit to the response profile for the multi-unit activity on each electrode. The ellipses are color coded to indicate which electrode on the MEA they were recorded from. The 100 electrodes densely tile an area of the visual field that is roughly 1.5 x 2 degrees. The two blue dots at the bottom indicate the distance between two electrodes on the MEA in retinal coordinates (below). C. The electrode spacing of the MEA projected onto the retina. Each blue dot would approximate the location of a retinal ganglion cell’s receptive field if the same MEA shown at top were implanted in the retina. The images of Ramon y Cajal and the MEA RF map are shown at the same size, in degrees of visual field, in the middle and bottom panels to highlight the large difference in spatial scales. D. Three images of Ramon y Cajal: the original image of Cajal (left, 406 x 300 pixels) and the same image down-sampled to either 58 x 60 pixels (middle) or 16 x 15 pixels (right). Panels A and B are unpublished data from the Born lab.
Figure 3
Figure 3
A monkey makes memory-guided saccades to both visual targets (top two rows) and to phosphenes elicited by microstimulation of electrodes implanted in V1 (bottom two rows). Saccades to phosphenes are less accurate than those to visual targets, yet they still reliably track the retinotopic locations of the electrodes. The gray circles represent either the location at which the visual target was flashed (top) or the receptive field location of the neurons at the electrode that was stimulated. Small black dots depict the saccade end-point on each trial. Used with permission from Bradley et al. 2005.
Figure 4
Figure 4
Macaque monkeys learn to better detect microstimulation in V1. Top left. Threshold currents for detection of an electrical stimulus during a two-interval forced-choice task. The monkey’s performance improved exponentially with a τ of 4700 trials and an asymptote of 5.4 μA. Even after one year of not performing the task, the monkey’s current detection thresholds remained low. Error bars indicate 67% confidence intervals. Top right. After electrical training, visual thresholds at the same V1 site were dramatically increased, but returned to normal after visual retraining (τ of 5300 trials and an asymptote of 18% contrast). Each point is the threshold determined from 100 trials. Bottom. Reciprocal nature of changes in detection thresholds for visual (left) and electrical (right) stimuli at different V1 sites (colors). Error bars indicate 95% confidence intervals. Used with permission from Ni & Maunsell 2010
Figure 5
Figure 5
A new quadrature code for vision. A. Eight rotations of a contrast edge symbolizing an image fragment from an external stimulus. B. The default, “pixel-to-electrode” code. In this example the image fragments in A are downsampled into a 3 pixel by 3 pixel representation. The intensity of each pixel maps onto a distinct electrode. Top, the portion of each image fragment that feeds into each pixel/electrode. Bottom, the corresponding electrode outputs over the full range of stimulus rotations. C. A hypothetical, “non-natural” code. This code calculates the dominant orientation and sign of the stimulus and represents this information using 2 electrodes. The first electrode transmits a signal proportional to the cosine of the calculated rotation and the second transmits a signal proportional to its sine; such signals are said to be in quadrature, as they are out of phase by 90 degrees. Top, the “coordinates” of the 2 electrode outputs at each of the rotations shown in A. Bottom, the corresponding electrode output over the full range of stimulus rotations.

References

    1. Auvray M, Hanneton S, O’Regan JK. Learning to perceive with a visuo-auditory substitution system: localisation and object recognition with ‘the vOICe’. Perception. 2007;36(3):416–430. - PubMed
    1. Bach-y-Rita P, Collins CC, Saunders FA, White B, Scadden L. Vision substitution by tactile image projection. Nature. 1969;221(5184):963–964. - PubMed
    1. Baker CI, Peli E, Knouf N, Kanwisher NG. Reorganization of visual processing in macular degeneration. Journal of Neuroscience. 2005;25(3):614–618. doi: 10.1523/JNEUROSCI.3476-04.2005. - DOI - PMC - PubMed
    1. Barlow H. What is the Computational Goal of the Neocortex? In: Koch C, Davis JL, editors. Large-Scale Neuronal Theories of the Brain. MIT Press; 1994. pp. 1–22.
    1. Bradley DC, Troyk PR, Berg JA, Bak M, Cogan S, Erickson R, et al. Visuotopic mapping through a multichannel stimulating implant in primate V1. Journal of Neurophysiology. 2005;93(3):1659–1670. doi: 10.1152/jn.01213.2003. - DOI - PubMed

Publication types