Validation of mismatch negativity and P3a for use in multi-site studies of schizophrenia: characterization of demographic, clinical, cognitive, and functional correlates in COGS-2
- PMID: 25449710
- PMCID: PMC4382452
- DOI: 10.1016/j.schres.2014.09.042
Validation of mismatch negativity and P3a for use in multi-site studies of schizophrenia: characterization of demographic, clinical, cognitive, and functional correlates in COGS-2
Abstract
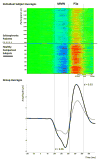
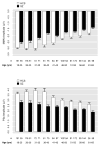
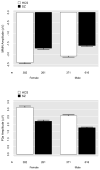
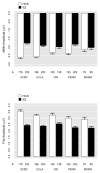
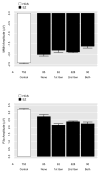
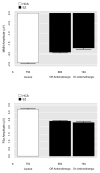
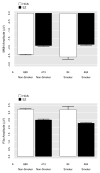
Mismatch negativity (MMN) and P3a are auditory event-related potential (ERP) components that show robust deficits in schizophrenia (SZ) patients and exhibit qualities of endophenotypes, including substantial heritability, test-retest reliability, and trait-like stability. These measures also fulfill criteria for use as cognition and function-linked biomarkers in outcome studies, but have not yet been validated for use in large-scale multi-site clinical studies. This study tested the feasibility of adding MMN and P3a to the ongoing Consortium on the Genetics of Schizophrenia (COGS) study. The extent to which demographic, clinical, cognitive, and functional characteristics contribute to variability in MMN and P3a amplitudes was also examined. Participants (HCS n=824, SZ n=966) underwent testing at 5 geographically distributed COGS laboratories. Valid ERP recordings were obtained from 91% of HCS and 91% of SZ patients. Highly significant MMN (d=0.96) and P3a (d=0.93) amplitude reductions were observed in SZ patients, comparable in magnitude to those observed in single-lab studies with no appreciable differences across laboratories. Demographic characteristics accounted for 26% and 18% of the variance in MMN and P3a amplitudes, respectively. Significant relationships were observed among demographically-adjusted MMN and P3a measures and medication status as well as several clinical, cognitive, and functional characteristics of the SZ patients. This study demonstrates that MMN and P3a ERP biomarkers can be feasibly used in multi-site clinical studies. As with many clinical tests of brain function, demographic factors contribute to MMN and P3a amplitudes and should be carefully considered in future biomarker-informed clinical studies.
Keywords: Cognition; EEG; Function; Mismatch negativity; P300; P3a; Schizophrenia.
Published by Elsevier B.V.
Conflict of interest statement
Dr. Light reports having been a consultant to EnVivo/Forum and Astellas and serves on an advisory board for Neuroverse. Dr. Green has been a consultant to AbbVie, Biogen, DSP, EnVivo/Forum and Roche, and he is on the scientific advisory board of Mnemosyne. He has received research funds from Amgen. Dr. Lazzeroni is an inventor on a patent application filed by Stanford University on genetic polymorphisms associated with depression. Dr. Nuechterlein has received unrelated research support from Janssen Scientific Affairs, Genentech, and Brain Plasticity, Inc., and has consulted to Genentech, Otsuka, Janssen, and Brain Plasticity, Inc. Dr. Swerdlow has been a consultant for Genco Sciences, Ltd. All other authors declare that they have no conflict of interest.
Figures

References
-
- Andreasen NC. Scale for the Assessment of Negative Symptoms (SANS) University of Iowa; Iowa City: 1984.
-
- Atkinson RJ, Michie PT, Schall U. Duration mismatch negativity and P3a in first-episode psychosis and individuals at ultra-high risk of psychosis. Biol Psychiatry. 2012;71(2):98–104. - PubMed
-
- Baker K, Baldeweg T, Sivagnanasundaram S, Scambler P, Skuse D. COMT Val108/158 Met modifies mismatch negativity and cognitive function in 22q11 deletion syndrome. Biological Psychiatry. 2005;58(1):23–31. - PubMed
-
- Baldeweg T, Wong D, Stephan KE. Nicotinic modulation of human auditory sensory memory: Evidence from mismatch negativity potentials. Int J Psychophysiol. 2006;59(1):49–58. - PubMed
-
- Belger A, Yucel GH, Donkers FC. In search of psychosis biomarkers in high-risk populations: is the mismatch negativity the one we’ve been waiting for? Biol Psychiatry. 2012;71(2):94–95. - PubMed
Publication types
MeSH terms
Grants and funding
- R37 MH042228/MH/NIMH NIH HHS/United States
- MH087889/MH/NIMH NIH HHS/United States
- R01 MH086135/MH/NIMH NIH HHS/United States
- R01 MH042228/MH/NIMH NIH HHS/United States
- R01 MH065571/MH/NIMH NIH HHS/United States
- R01-MH65707/MH/NIMH NIH HHS/United States
- R01-MH065571/MH/NIMH NIH HHS/United States
- MH079777/MH/NIMH NIH HHS/United States
- R01-MH65578/MH/NIMH NIH HHS/United States
- R01 MH065558/MH/NIMH NIH HHS/United States
- R01 MH079777/MH/NIMH NIH HHS/United States
- R01 MH065554/MH/NIMH NIH HHS/United States
- R01 MH065578/MH/NIMH NIH HHS/United States
- R01-MH65558/MH/NIMH NIH HHS/United States
- R01-MH065554/MH/NIMH NIH HHS/United States
- MH042228/MH/NIMH NIH HHS/United States
- R01 MH065707/MH/NIMH NIH HHS/United States
- K01 MH087889/MH/NIMH NIH HHS/United States
LinkOut - more resources
Full Text Sources
Other Literature Sources
Medical
Research Materials
Miscellaneous

