. 2015 Jan 15:105:198-207.
doi: 10.1016/j.neuroimage.2014.10.053. Epub 2014 Oct 31.

Probing region-specific microstructure of human cortical areas using high angular and spatial resolution diffusion MRI

Affiliations

Probing region-specific microstructure of human cortical areas using high angular and spatial resolution diffusion MRI

Manisha Aggarwal et al. Neuroimage. .

Abstract

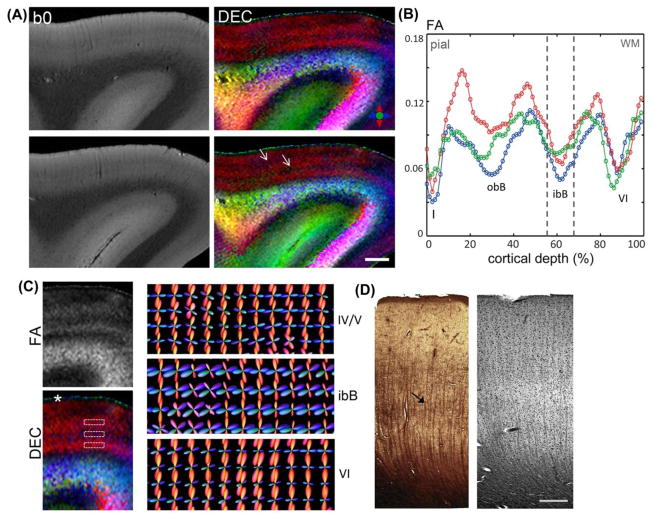
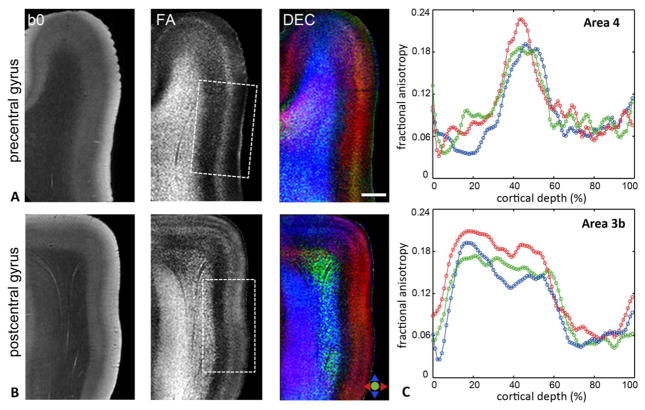
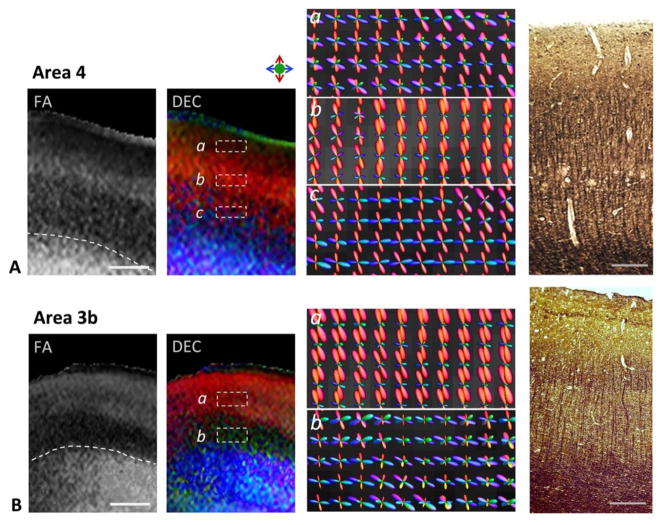
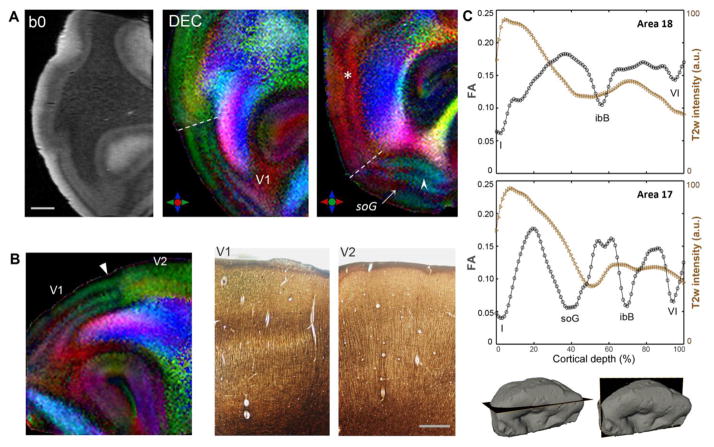
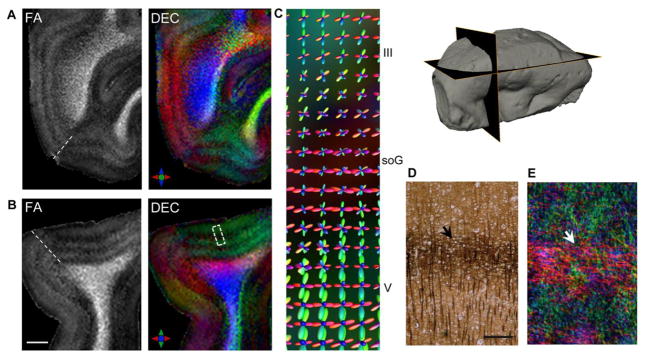
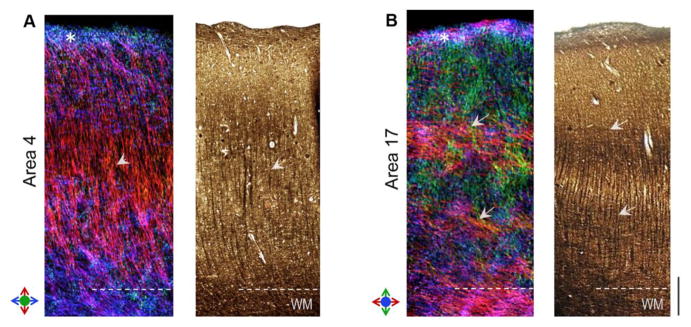
Regional heterogeneity in cortical cyto- and myeloarchitecture forms the structural basis of mapping of cortical areas in the human brain. In this study, we investigate the potential of diffusion MRI to probe the microstructure of cortical gray matter and its region-specific heterogeneity across cortical areas in the fixed human brain. High angular resolution diffusion imaging (HARDI) data at an isotropic resolution of 92-μm and 30 diffusion-encoding directions were acquired using a 3D diffusion-weighted gradient-and-spin-echo sequence, from prefrontal (Brodmann area 9), primary motor (area 4), primary somatosensory (area 3b), and primary visual (area 17) cortical specimens (n=3 each) from three human subjects. Further, the diffusion MR findings in these cortical areas were compared with histological silver impregnation of the same specimens, in order to investigate the underlying architectonic features that constitute the microstructural basis of diffusion-driven contrasts in cortical gray matter. Our data reveal distinct and region-specific diffusion MR contrasts across the studied areas, allowing delineation of intracortical bands of tangential fibers in specific layers-layer I, layer VI, and the inner and outer bands of Baillarger. The findings of this work demonstrate unique sensitivity of diffusion MRI to differentiate region-specific cortical microstructure in the human brain, and will be useful for myeloarchitectonic mapping of cortical areas as well as to achieve an understanding of the basis of diffusion NMR contrasts in cortical gray matter.

Keywords: Cortical areas; Diffusion MRI; Gray matter; Human; Microstructure.


Figures

Figure 1
Figure 1
Diffusion microimaging of cortical gray matter in the prefrontal cortex (Brodmann area 9). A) b0 images and corresponding DEC maps of two slices through the superior frontal gyrus. White arrows indicate two zones of low anisotropy compared to adjacent layers resolved parallel to the cortical surface. B) FA profiles measured across cortical depth in the three subjects (denoted by red, blue, green). Values plotted are the mean FA measurements averaged over cortical depth profiles within regions of 4-mm thickness in each subject. Dashed lines indicate the position of the local minimum corresponding to the inner band of Baillarger (ibB); obB: outer band of Baillarger, Roman numerals denote cortical layers. C) Left, Magnified views of FA and DEC maps across cortical gray matter. White asterisk marks cortical layer I, demarcated by a sharp transition from the radially-oriented anisotropy of underlying layers. Right, Reconstructed fODFs in cortical laminae (regions marked by dashed white boxes in the DEC map) indicate prominent radial and tangential peaks resolved in the ibB compared to adjacent layers. D) Silver-impregnated section through area 9 (left) and luxol fast blue section co-stained with H&E for marking cell nuclei (right). Black arrow indicates faintly-stained dense horizontal fibers evident in the ibB in the silver-stained section. Scale bar for A = 2 mm, scale bar for D = 0.5 mm.
Figure 2
Figure 2
A–B) b0, FA, and DEC maps through the precentral and postcentral gyri demonstrate region-specific contrasts resolved in the primary motor (area 4) and primary somatosensory (area 3b) cortices (areas indicated by the dashed white boxes). Colors in the DEC maps denote the primary orientation of diffusion as indicated by the color index. C) Plots show quantitative FA profiles measured as a function of cortical depth from the pial surface in areas 4 (top) and 3b (bottom) for the three subjects. Values plotted are mean FA measurements calculated over regions-of-interest of ~4 mm thickness in the cortical gray matter, with the abscissa normalized to percentage of total cortical depth for each subject. Scale bar = 2 mm.
Figure 3
Figure 3
Region-specific differences in the M1 (area 4, top panel) and S1 (area 3b, bottom panel) cortical areas seen with diffusion contrasts and estimated fiber orientation distributions across cortical depth. Representative sections through areas 4 and 3b with FA and DEC contrasts are shown. Dashed white lines indicate the boundary between gray matter and subcortical white matter in the FA maps. Panels ac (in A) and ab (in B) are high-magnification views showing reconstructed fODFs in different regions across the cortical depth (areas marked by dashed white boxes in DEC maps) in areas 4 and 3b, respectively. fODF surfaces are colored based on 3D spatial orientation as indicated by the color index. Corresponding silver-impregnated histological sections from areas 4 and 3b are shown in the right panel. Scale bars = 1 mm, scale bars for histology sections = 0.5 mm.
Figure 4
Figure 4
Laminar structure of the human visual cortex (Brodmann areas 17, 18) delineated with diffusion MRI. A) b0 image and corresponding DEC contrasts in orthogonal planes through the occipital lobe. The anatomical locations of the sections are indicated in the surface reconstructions at the bottom right. Two distinct layers marked by tangential diffusion anisotropy can be resolved in the primary visual area (V1), corresponding to the stria of Gennari in layer IV (soG, white arrow) and the ibB in layer V (white arrowhead). A marked transition in laminar structure between V1 and the secondary visual area V2 is clearly delineated (dashed white lines). Asterisk marks the tangential ibB resolved in V2. B) Magnified view of DEC map demonstrates the transition in diffusion MR contrasts resolved at the V1/V2 border (white arrowhead, left), which closely mirrors the change in layered architecture seen with silver-stained sections adjacent to the V1-V2 boundary (right). C) FA and T2w intensity profiles across areas 18 (top) and 17 (bottom) plotted as a function of cortical depth. Local minima in FA profiles correspond to bands of tangential fibers in distinct cortical layers indicated by Roman numerals. Scale bar in A = 2 mm, scale bar in B = 0.5 mm.
Figure 5
Figure 5
Delineation of the stria of Gennari (soG) based on diffusion MR contrasts in the primary visual area (Brodmann area 17). A–B) FA and DEC maps in orthogonal views demonstrate layer-specific variation in anisotropy resolved across the cortical gray matter. Note that the plane of the sections in A–B intersects the V1 surface at an oblique angle owing to the curvature of the cortical surface (indicated in the surface reconstruction at the top right). C) Magnified view shows reconstructed fODFs overlaid on the DEC map (corresponding to a small region within the dashed white box in B), indicating dominant tangential peaks in the soG in comparison to inner and outer adjoining cortical layers. Silver-impregnated histological section at the level of the soG (D) demonstrates the horizontal plexus of densely labeled fibers in the soG (black arrow) with radially-oriented fibers apparent in adjacent layers. E) Track-density map generated from probabilistic tractography indicates a band of dense crossing horizontal fibers corresponding to the soG (white arrow) and intervening radial fiber orientations resolved with the HARDI data. Scale bar for A-B = 2 mm, scale bar in D = 250 μm.
Figure 6
Figure 6
Comparison of region-specific microstructure of the astriate (primary motor, area 4) and bistriate (primary visual, area 17) cortical areas resolved with dMRI. Track-density maps of area 4 (left panel) and area 17 (right panel) are compared with Bielschowsky silver impregnation of the two areas. Colors in TDI maps denote the local orientation of fibers as indicated by the color indexes. Arrowheads in A indicate a high density of radial fibers resolved in the mid-cortical layers of area 4. Arrows in B mark the distinct bands of tangential fibers resolved in area 17, corresponding to the inner and outer bands of Baillarger. White asterisks mark cortical layer I delineated in dMRI contrasts in both A and B. Scale bar = 0.5 mm.

References

    1. Aggarwal M, Gobius I, Richards LJ, Mori S. Diffusion MR Microscopy of Cortical Development in the Mouse Embryo. Cereb Cortex. 2014 doi: 10.1093/cercor/bhu006. - DOI - PMC - PubMed
    1. Aggarwal M, Mori S, Shimogori T, Blackshaw S, Zhang J. Three-dimensional diffusion tensor microimaging for anatomical characterization of the mouse brain. Magn Reson Med. 2010;64:249–261. - PMC - PubMed
    1. Amunts K, Malikovic A, Mohlberg H, Schormann T, Zilles K. Brodmann’s areas 17 and 18 brought into stereotaxic space-where and how variable? Neuroimage. 2000;11:66–84. - PubMed
    1. Amunts K, Schleicher A, Zilles K. Architectonic mapping of the human cerebral cortex. In: Schuz A, Miller R, editors. Cortical areas: unity and diversity. Taylor & Francis; New York: 2002.
    1. Anwander A, Pampel A, Knosche TR. In vivo measurement of cortical anisotropy by diffusion-weighted imaging correlates with cortex type. Proceedings of the International Society for Magnetic Resonance in Medicine; 2010. p. 109.

Publication types

LinkOut - more resources