Comparative Study
. 2015 Feb:74:89-101.
doi: 10.1016/j.nbd.2014.11.007. Epub 2014 Nov 15.

Ginsenoside Rb1 inhibits fibrillation and toxicity of alpha-synuclein and disaggregates preformed fibrils

Affiliations
Comparative Study

Ginsenoside Rb1 inhibits fibrillation and toxicity of alpha-synuclein and disaggregates preformed fibrils

Mustafa T Ardah et al. Neurobiol Dis. 2015 Feb.

Abstract

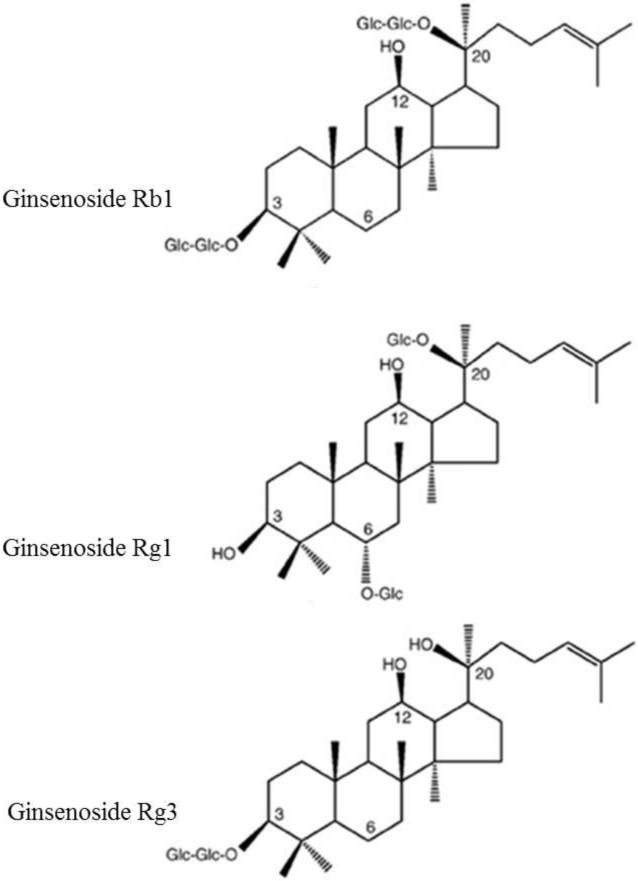
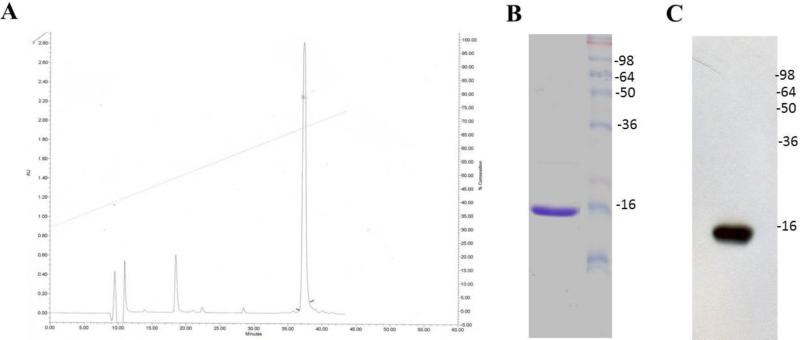
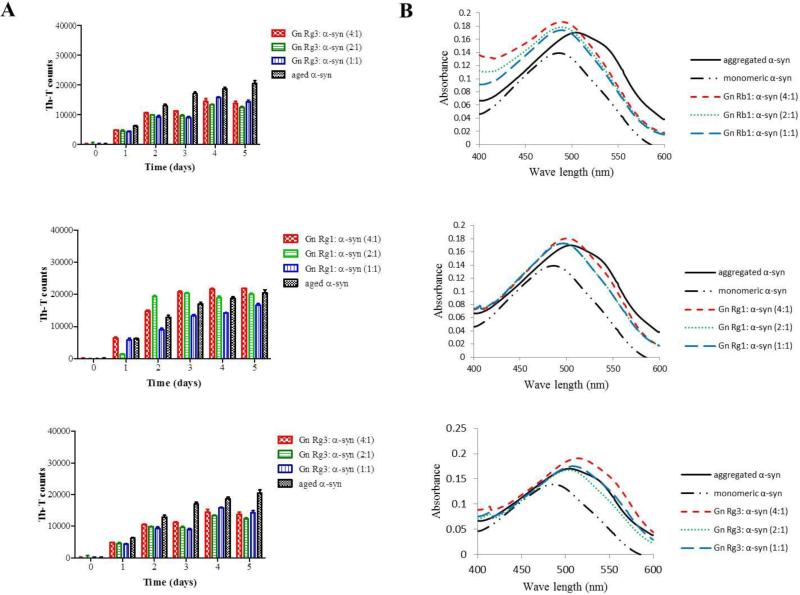
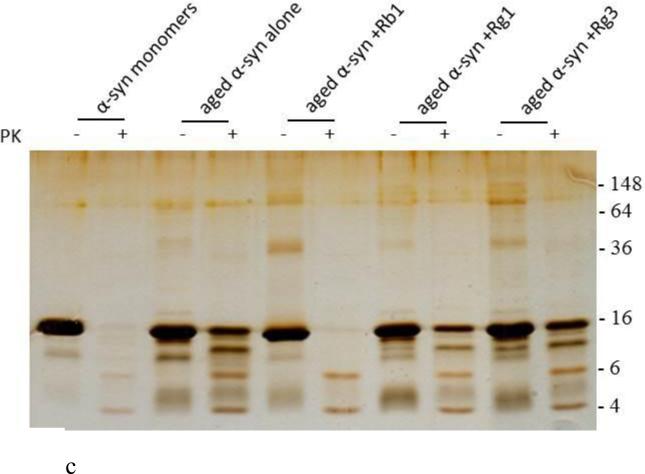
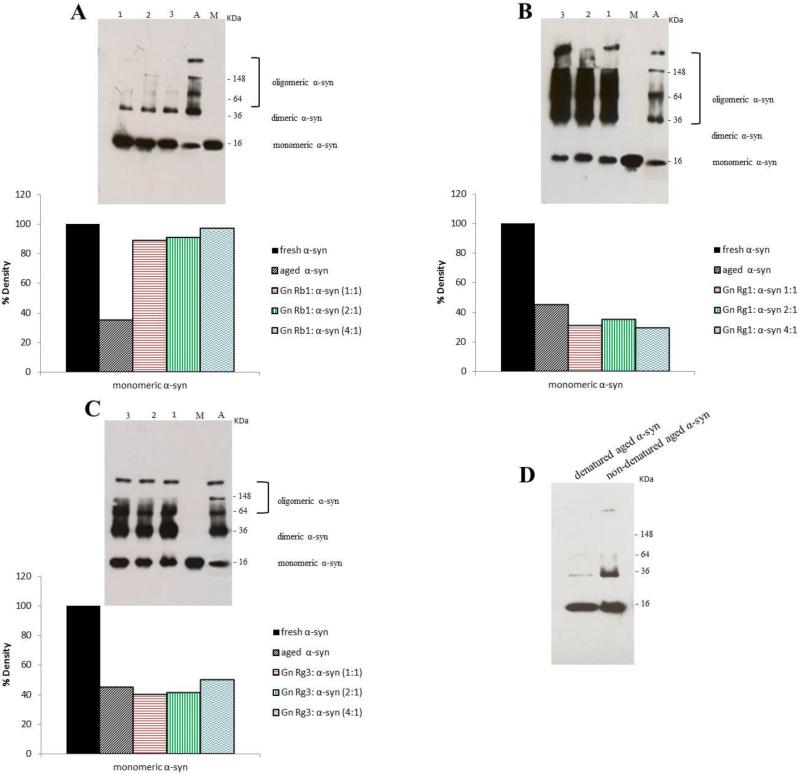
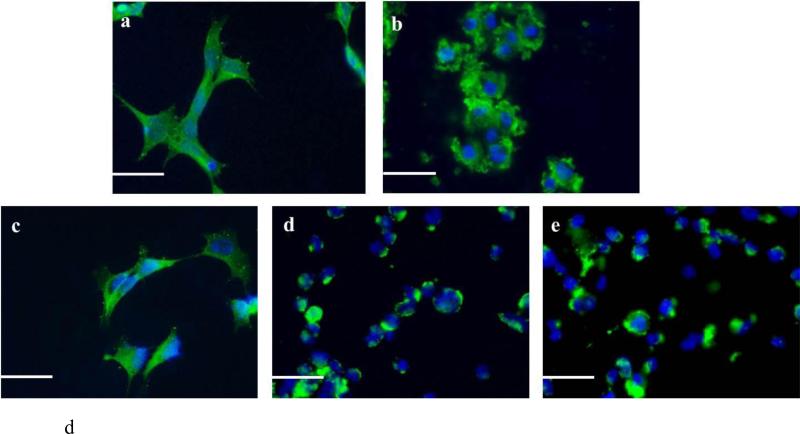
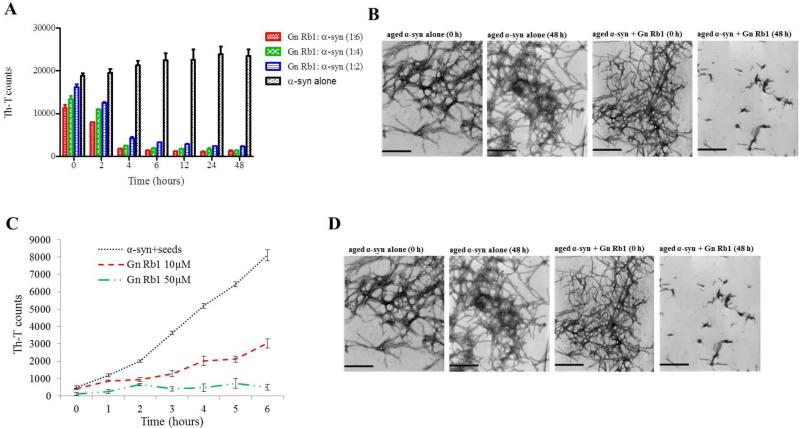
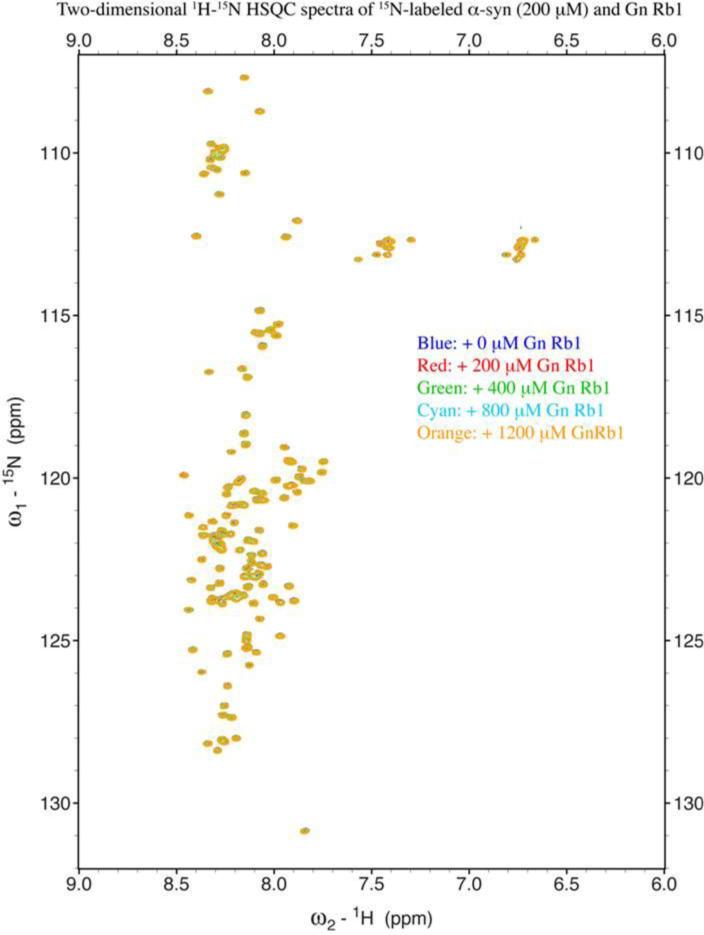
Compelling evidence indicates that α-synuclein (α-syn) aggregation plays a central role in the pathogenesis of Parkinson's disease (PD) and other synucleinopathies. Identification of compounds that inhibit or reverse the aggregation process may thus represent a viable therapeutic strategy against PD and related disorders. Ginseng is a well-known medicinal plant that has been used in East Asia for more than two thousand years to treat several conditions. It is now understood that the pharmacological properties of ginseng can be attributed to its biologically active components, the ginsenosides, which in turn have been shown to have neuroprotective properties. We therefore sought to determine for the first time, the potential of the most frequently used and studied ginsenosides, namely Rg1, Rg3 and Rb1, as anti-amyloidogenic agents. The effect of Rg1, Rg3 and Rb1 on α-syn aggregation and toxicity was determined by an array of biophysical, biochemical and cell-culture-based techniques. Among the screened ginsenosides, only Rb1 was shown to be a potent inhibitor of α-syn fibrillation and toxicity. Additionally, Rb1 exhibited a strong ability to disaggregate preformed fibrils and to inhibit the seeded polymerization of α-syn. Interestingly, Rb1 was found to stabilize soluble non-toxic oligomers with no β-sheet content, that were susceptible to proteinase K digestion, and the binding of Rb1 to those oligomers may represent a potential mechanism of action. Thus, Rb1 could represent the starting point for designing new molecules that could be utilized as drugs for the treatment of PD and related disorders.

Keywords: Aggregation; Amyloid fibrils; Drug discovery; Ginsenosides; Parkinson's disease; α-Synuclein.


Figures

Figure 1
Figure 1
Chemical structure of ginsenoside Rb1, ginsenoside Rg1, ginsenoside Rg3.
Figure 2
Figure 2
HPLC analysis and characterization of crude α-syn. A. HPLC analysis was done using phenomenex Jupiter C4 (250 3 4.6 mm) column, with a gradient of 30%-80% solvent B in solvent A at 0.5 ml/minute over 38 minutes. B. Coomassie blue staining of 15% SDS-PAGE for HPLC purified recombinant α-syn. C. Immunoblotting for HPLC purified α-syn detected by mAb 211.
Figure 3
Figure 3. Gn Rb1 inhibits α-syn fibrillation
A. Samples of α-syn (25 μM) were incubated for 5 days at 37°C with continuous shaking in the presence of various concentrations of the ginsenosides Rb1, Rg1 and (20S)-Rg3 (100 μM, 50 μM and 25 μM). Fibril formation was measured by Th-T binding assay. The assay was performed in triplicate, and the means ± standard deviations are shown. B. Congo red binding for Gn Rb1, Gn Rg1 and Gn (20S)-Rg3. α-Syn (5 μM) aged alone or in the presence of different concentrations of ginsenosides was mixed with Congo red (final concentration of 5 μM). The UV absorbance spectrum was recorded from 400 to 600 nm in a spectrophotometer. C. Silver staining for 15% SDS gel of α-syn monomers, α-syn aged alone or in the presence of Rb1, Rg1 and Rg3 at molar ratio 1:1 after 2.5 μg/ml PK digestion. D. Electron microscopy images of negatively stained samples of α-syn (25 μM) aged alone or in the presence of the ginsenosides (gincenoside: α-syn molar ratios of 4:1, 2:1, and 1:1) for 5 days with continuous shaking at 37°C. Scale bar, 500 nm.
Figure 4
Figure 4. Immunoblot analysis showing the effect of ginsenosides on α-syn oligomerization
α-Syn alone or in the presence of ginsenosides at ginsenoside: α-syn molar ratios of 1:1, 2:1 and 4:1, was incubated for 5 days. Lane 1, ginsenoside: α-syn 1:1, lane 2, ginsenoside: α-syn 2:1, lane 3, ginsenoside: α-syn 4:1, A: aged α-syn and M: fresh α-syn. A. Gn Rb1, B. Gn Rg1, C. Gn Rg3. The amount of the monomeric α-syn in the samples was quantified using ImageJ software. D. Immunoblotting for aged α-syn samples under denaturing and non-denaturing conditions.
Figure 5
Figure 5. The effect of the ginsenosides on the toxicity induced by the aggregates of α-syn
The viability of BE(2)-M17 human cells was evaluated by MTT assay. The results are expressed as percentages of the average of the control (i.e. untreated cells). The cells were treated with either α-syn aged with or without the A. Rb1, B. Rg1, and C. Rg3 for 48 hours prior to the addition of MTT. The graphs appearing on the left panel illustrate the toxicity of the compounds alone (average of 3 wells ± standard deviation). Statistical analysis was performed using a two-tailed unpaired t-test. ***, p< 0.001; **, p< 0.01; *, p< 0.05. D. Immunocytochemistry against α-syn of BE(2)-M17 cells. a.The cells were either non-treated or treated for 48 hours with 5 μM of b. aged α-syn alone, or with ginsenoside c. Rb1, d. Rg1, e. Rg3. at a molar ratio of aged α-syn: compound 1:4. Scale bar 30 μm.
Figure 6
Figure 6. The effect of Gn Rb1 on preformed α-syn fibrils and on the seeded polymerization of α-syn
A. Samples of aggregated α-syn were incubated for 48 hours at 37°C in the absence or presence of various concentrations of Gn Rb1 (Gn Rb1: α-syn at 6:1, 4:1, and 2:1). The fibril content was then measured by the Th-T binding assay. The assay was performed in triplicate (average of triplicate measurements ± standard deviations). B. Electron microscopy images of negatively stained samples of the pre-aggregated α-syn incubated alone or in the presence of Gn Rb1 (1:4) for 0 and 48 hours with continuous shaking at 37°C. Scale bar, 500 nm. C. Samples of α-syn monomers (100 μM) were seeded with 2 μM sonicated α-syn fibrils, which were incubated in the presence or absence of Gn Rb1 at different concentrations (10 and 50 μM) for 6 hours with continuous shaking at 37°C. The extent of fibrillation was estimated by the Th-T binding assay. The assay was performed in triplicate (average of triplicate measurements ± standard deviations). D. Electron microscopy images of negatively stained samples of the α-syn seeds alone and of the seeded α-syn incubated in the absence or presence of Gn Rb1 (50 μM) for 6 hours with continuous shaking at 37°C. Scale bar, 1,000 nm.
Figure 7
Figure 7. Gn Rb1 binds to α-syn oligomers (Gn Rb1: α-syn molar ratio of 4:1)
A. Gel filtration profile of the 5-day aggregated α-syn in the presence of Gn Rb1 at a (Gn Rb1: α-syn) molar ratio 4:1 (α-syn concentration =100 μM) using a superdex 200 SE column. P1 and P2 samples contain the isolated fractions corresponding to the oligomeric peak and P3 the isolated fractions corresponding to the monomeric peak. The elution was monitored at the absorbance wavelength of 215 nm, immunoblot analysis of the samples P1 P2 and P3 separated by electrophoresis in a 15% SDS-PAGE gel. B. Electron microscopy images of negatively stained samples P1, P2 and P3 of α-syn in the presence of Gn Rb1 (molar ratio of Gn Rb1: α-syn 4:1) purified by SEC. Scale bar, 500 nm. C. UV absorbance spectra of Gn Rb1 alone. The UV absorbance was recorded between 200-600 nm employing a 10 mm quartz cuvette. D. UV absorbance spectra P1, P2 and P3. The UV absorbance was recorded between 200-600 nm employing a 10 mm quartz cuvette.
Figure 8
Figure 8. Analysis of Gn Rb1 binding to monomeric α-syn by NMR spectroscopy
Proton-Nitrogen correlation (HSQC) spectra of monomeric α-syn in the presence of increasing ratios of Gn Rb1: α-syn demonstrating that there are no significant changes in the positions of the NMR resonances, indicating the lack of an interaction between Gn Rb1 and monomeric α-syn. Protein concentration: 200 μM.
Figure 9
Figure 9
Peak intensity ratio plot of 200 μM 15N-labeled wt α-syn FL + Gn Rb1 (Gn Rb1: α-syn 1:1, 2:1, 4:1 and 6:1). From the HSQC spectra and the intensity plot, there might be no interaction between α-syn monomer and Gn Rb1. A. all; B. 1:1/0:1 and 0:1/0:1; C. 2:1/0:1 and 0:1/0:1; D. 4:1/0:1 and 0:1/0:1; E. 6:1/0:1 and 0:1/0:1.

References

    1. Ardah MT, Paleologou KE, Lv G, Abul Khair SB, Kazim AS, Minhas ST, El-Agnaf OM. Structure activity relationship of phenolic acid inhibitors of α-synuclein fibril formation and toxicity. Front Aging Neurosci. 2014;6:197. doi: 10.3389/fnagi.2014.00197. - PMC - PubMed
    1. Attele AS, Wu JA, Yuan CS. Ginseng pharmacology: multiple constituents and multiple actions. Biochem Pharmacol. 1999;58(11):1685–1693. - PubMed
    1. Baba M, Nakajo S, Tu PH, Tomita T, Nakaya K, Lee VM, Iwatsubo T. Aggregation of alpha-synuclein in Lewy bodies of sporadic Parkinson's disease and dementia with Lewy bodies. Am J Pathol. 1998;152(4):879–884. - PMC - PubMed
    1. Bussell R, Eliezer D. A structural and functional role for 11-mer repeats in alpha-synuclein and other exchangeable lipid binding proteins. J Mol Biol. 2003;329(4):763–778. - PubMed
    1. Caruana M, Högen T, Levin J, Hillmer A, Giese A, Vassallo N. Inhibition and disaggregation of α-synuclein oligomers by natural polyphenolic compounds. FEBS Lett. 2011;585(8):1113–1120. doi: 10.1016/j.febslet.2011.03.046. - PubMed

Publication types

MeSH terms